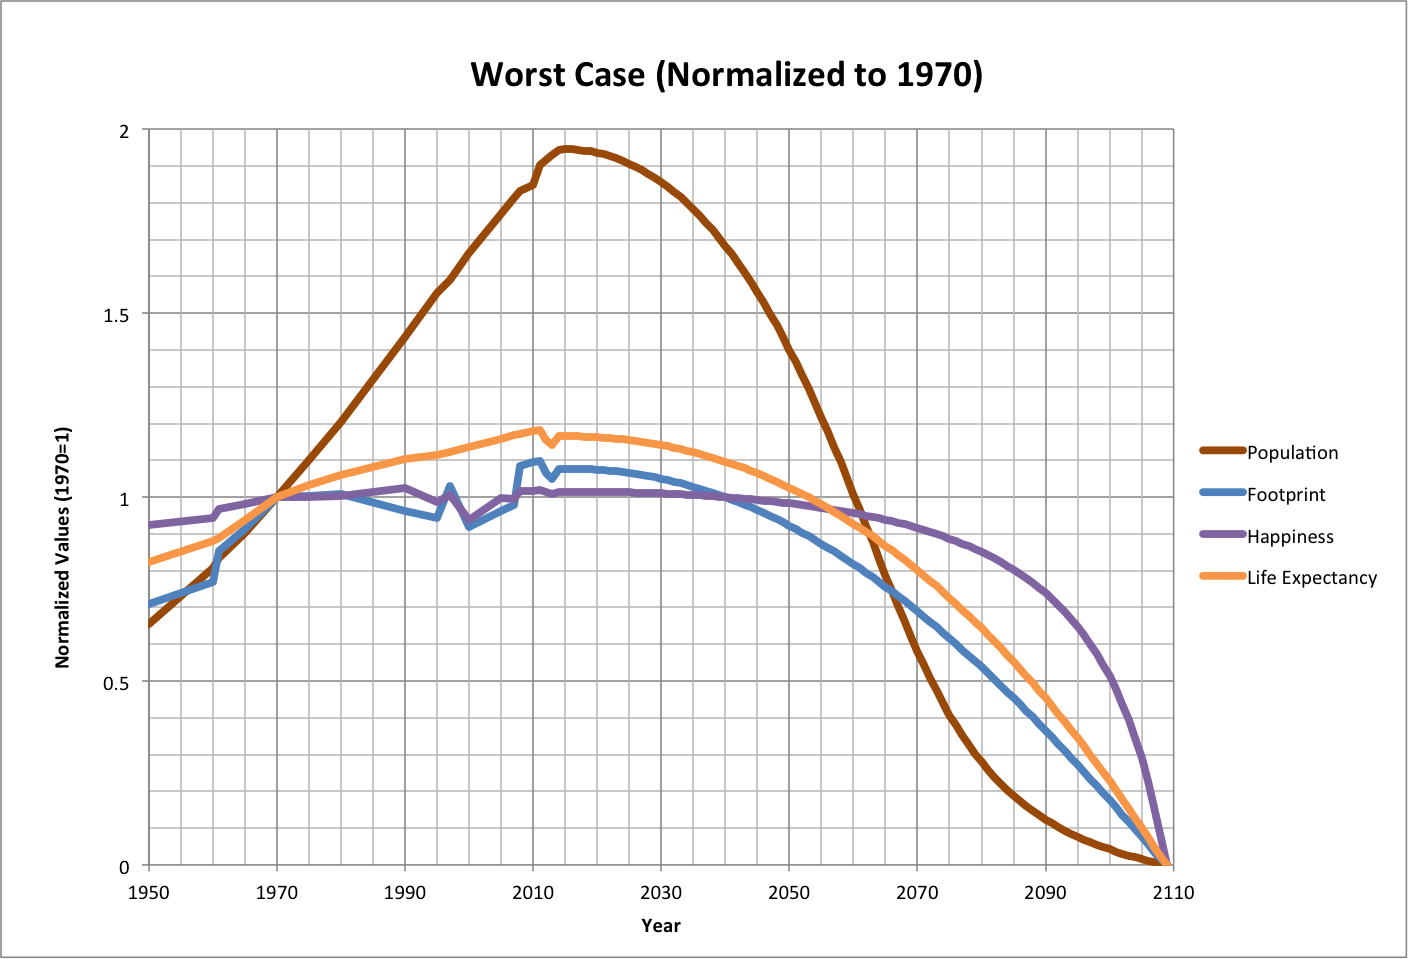
The Worst case scenario has population reaching a peak in 2015 and declining to zero by 2110.
The following graph illustrates the near-term trajectories of these variables, normalized to their values in 1970 (about the time that the total ecological footprint last enabled other species to fully provide renewable ecological resources and have enough left for their own survival).
 |
The peak may be explained by an inability to grow the number of inhabited environments, and perhaps being forced decrease in them.
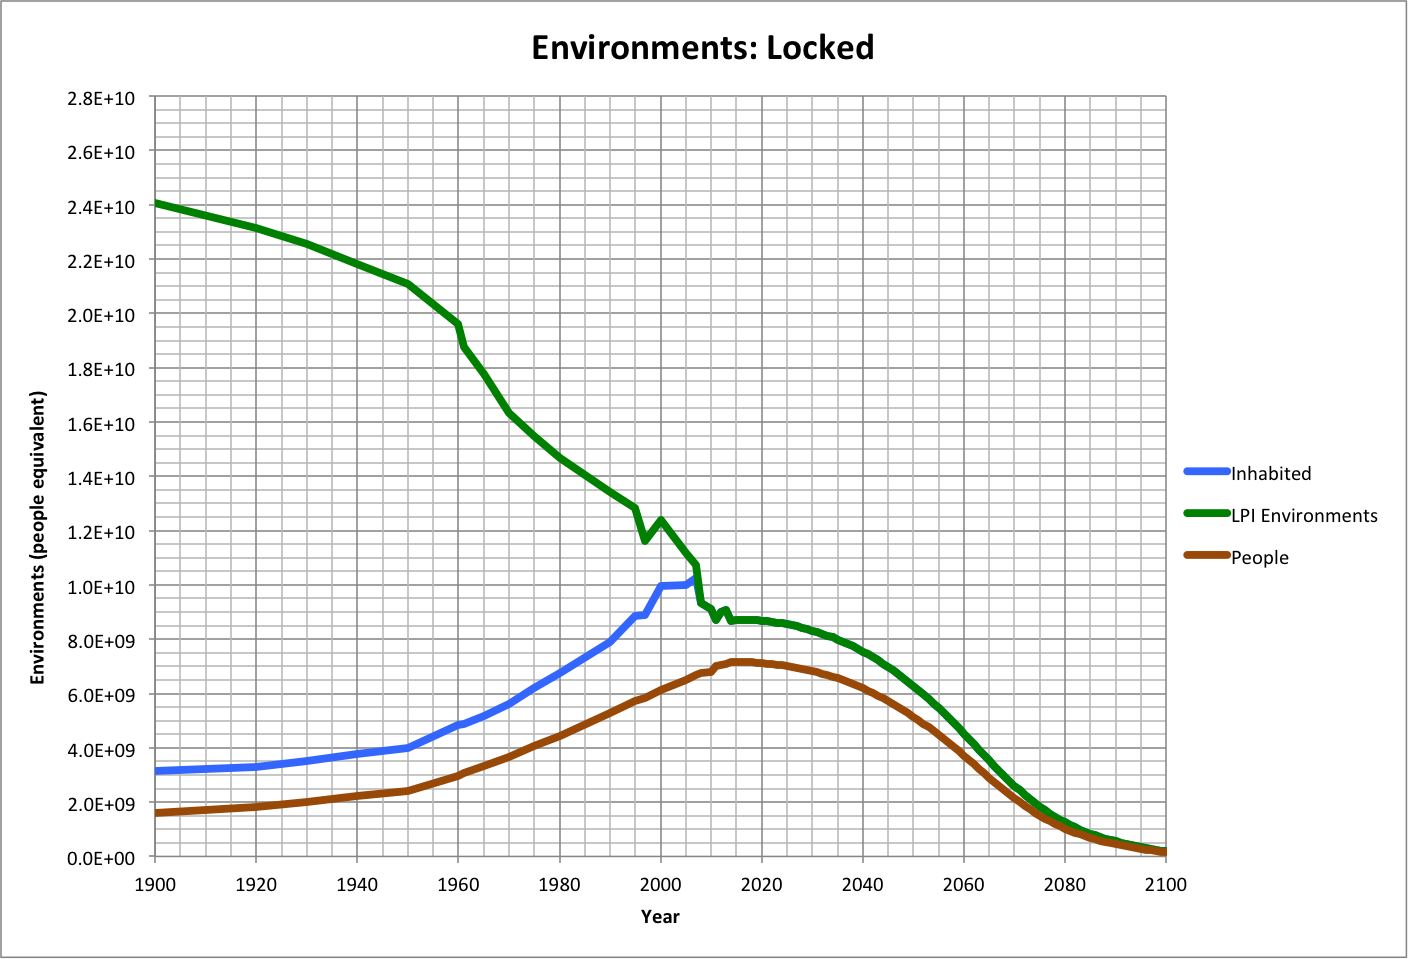
One mechanism is suggested by scaling the maximum environments to the Living Planet Index (LPI) using its relationship to total ecological footprint as derived in Version 3 and defined in 2010. Recall that LPI is roughly proportional to the populations of other species. Our consumption of ecological resources leaves less for other species, and also kills them outright. Based on the work in Version 3, LPI has a maximum ("LPImax") when footprint ("F") equals zero: LPI(F=0) = LPImax. The largest amount of maximum environments (also when F = 0) is the same as the number of inhabited environments when happiness is at its maximum (Epop when h = hmax).
As shown in Figure A below, total environments scaled to LPI is projected to have equaled inhabited environments in 2008.
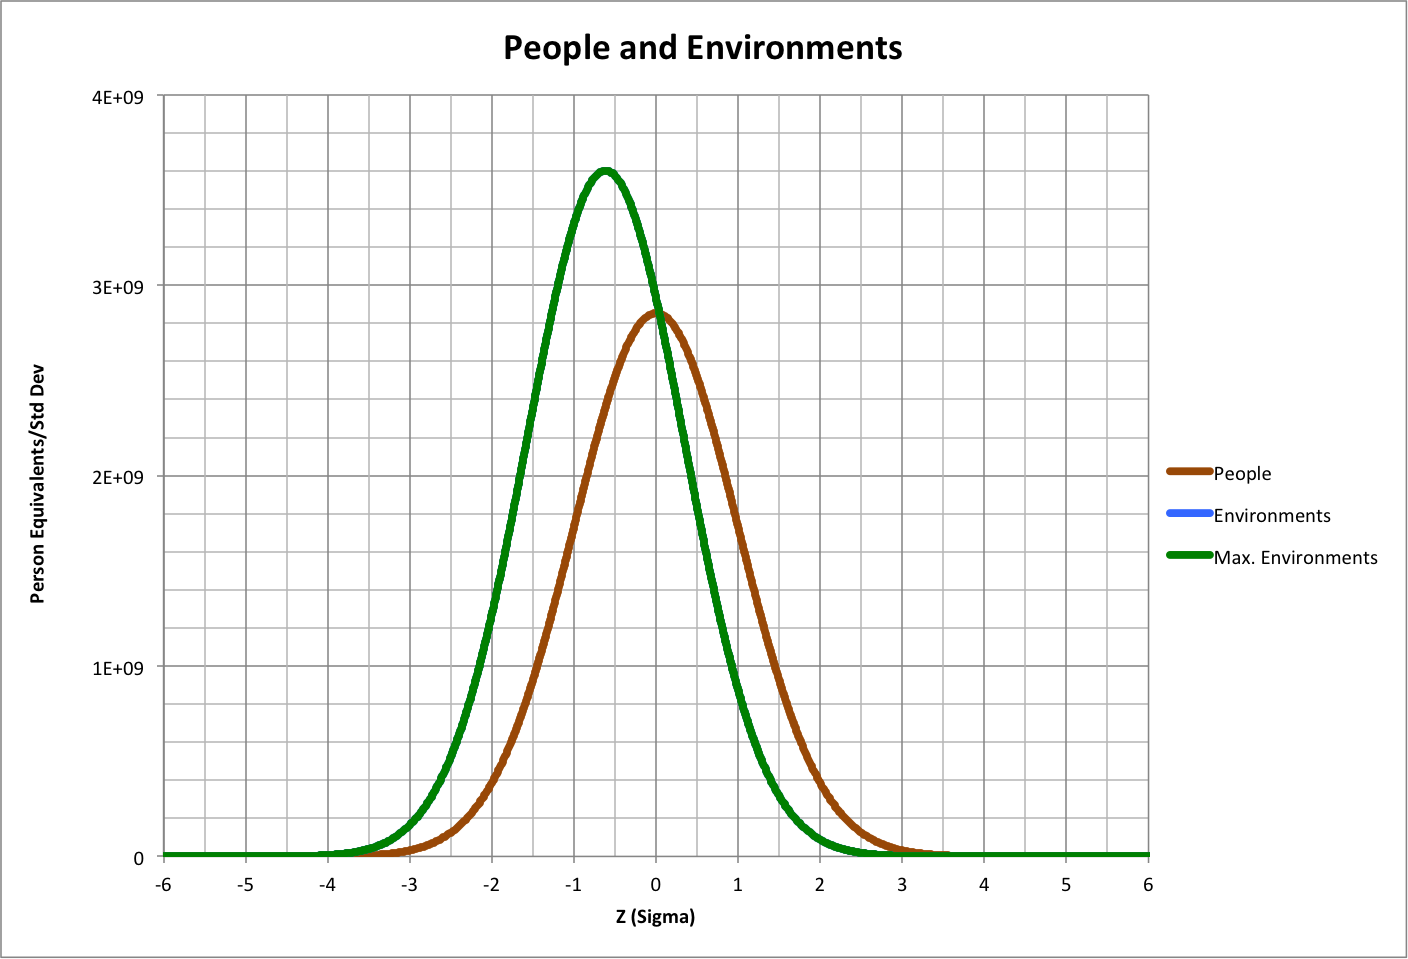
Since resources are required to maintain the inhabited envoironments, these resources would be drawn from internal supplies, further drawing down the LPI. Since inhabited environments cannot exceed total environments, they are locked together until — or if — total environments can increase. By this year (2014), the ratio of human population to environments (Pop/Epop) will approach the maximum happiness limit (0.82), while actual happiness remains lower, perhaps due to redistribution of resources among the population since 2008, as shown in Figure B for 2014.
Figure A |
Figure B |
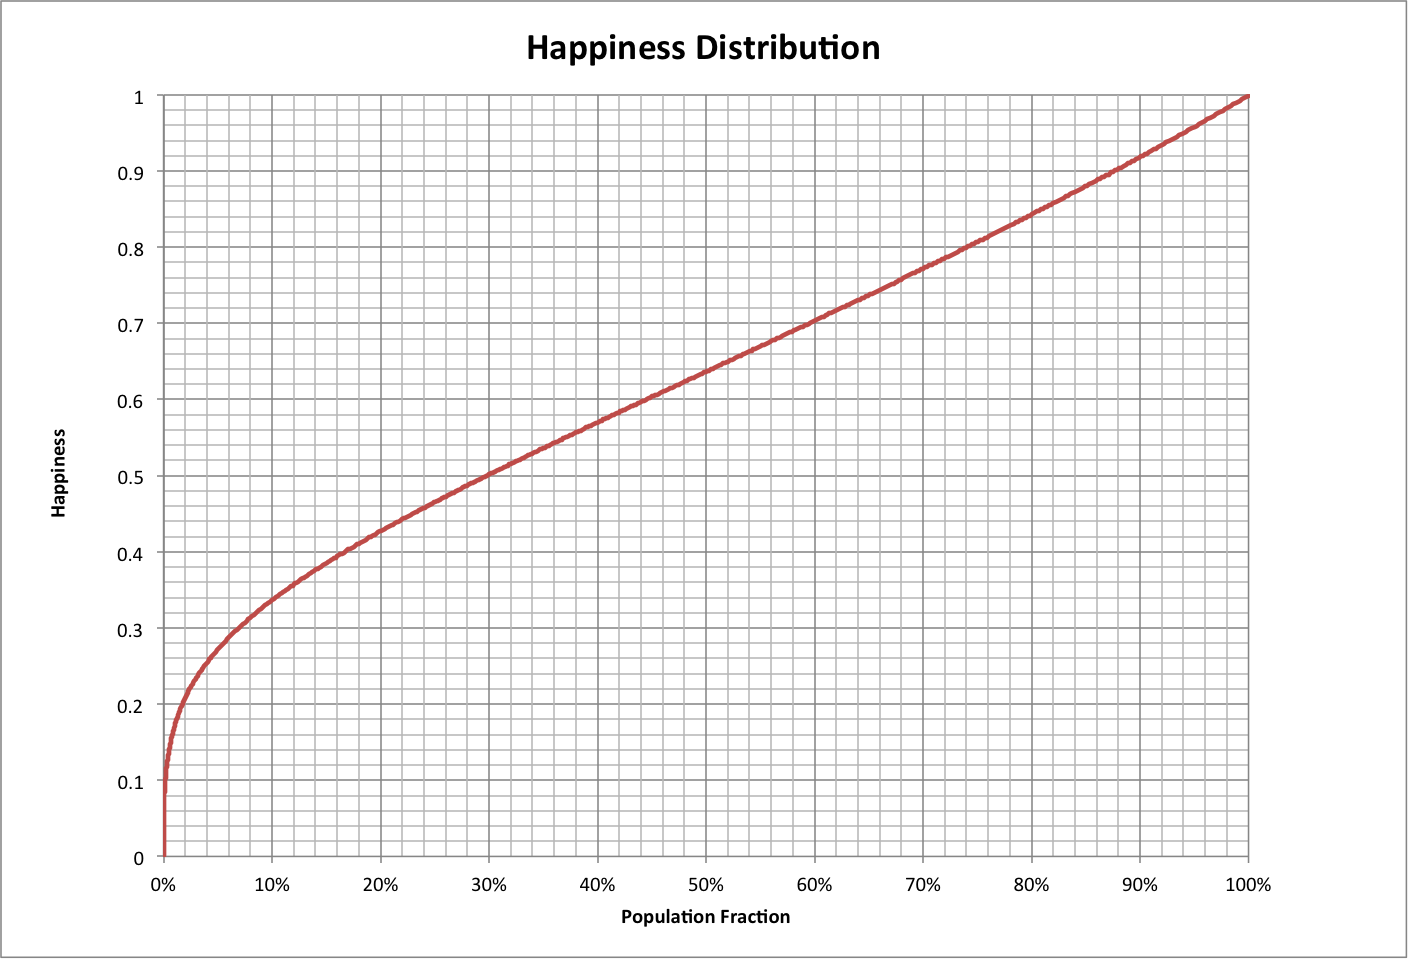 |
Figure C
See also:
Population-Consumption v4 Main Page