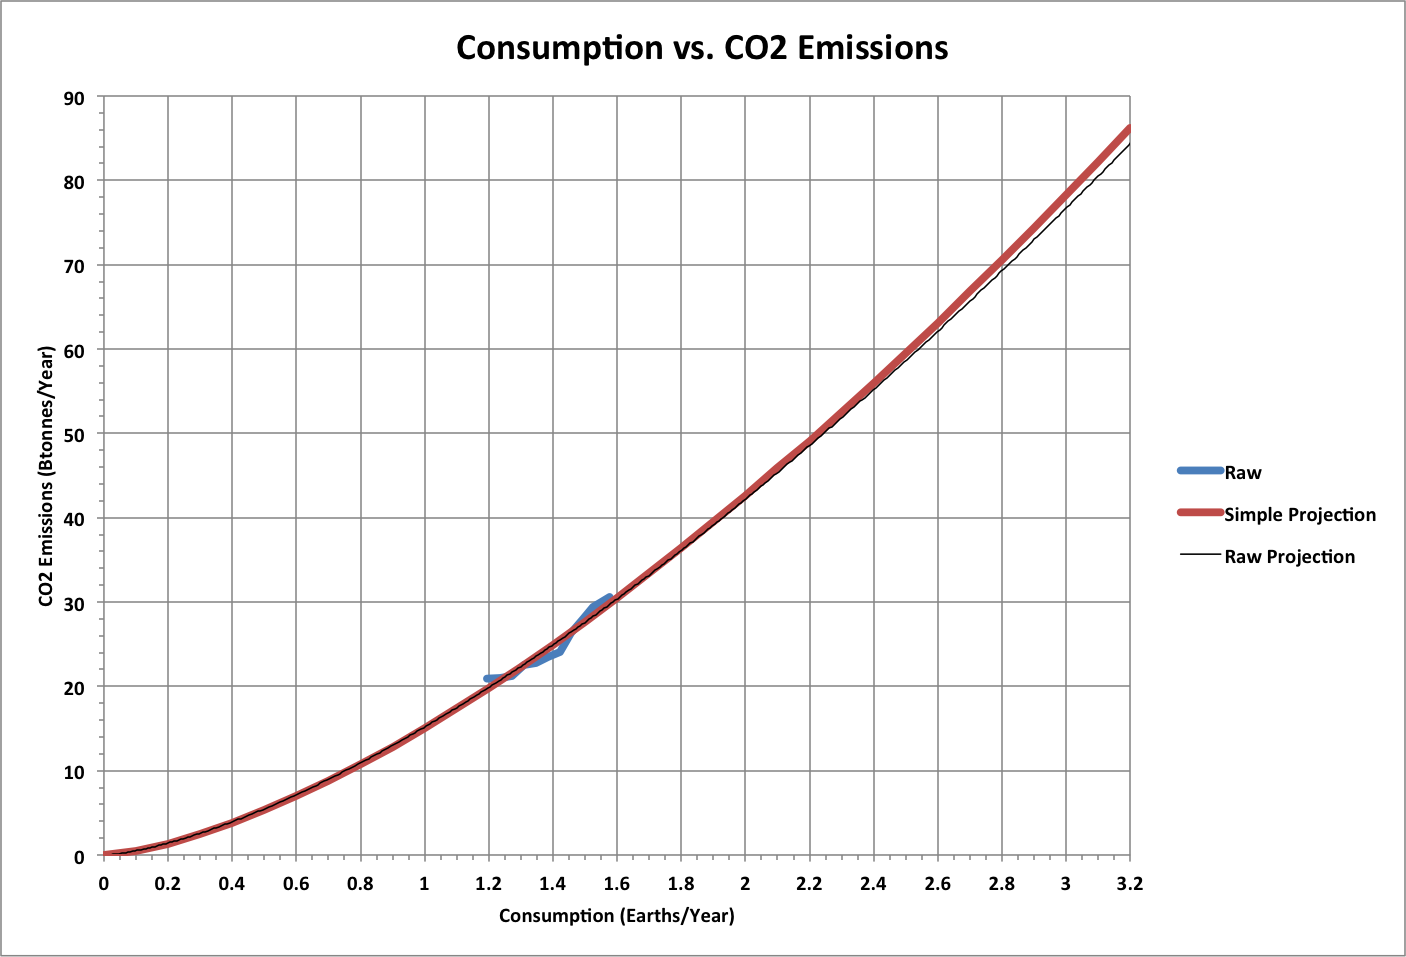
Carbon dioxide emissions appear to vary exponentially with consumption.
Here:
- Raw is raw data
- Simple Projection is based on emissions being proportional to Consumption1.5:
Emissions = 15.0608995486609 * Consumption1.5
- Raw Projection is a curve fit of the raw data
Emissions = 15.1836523210013 * Consumption1.47429679564025
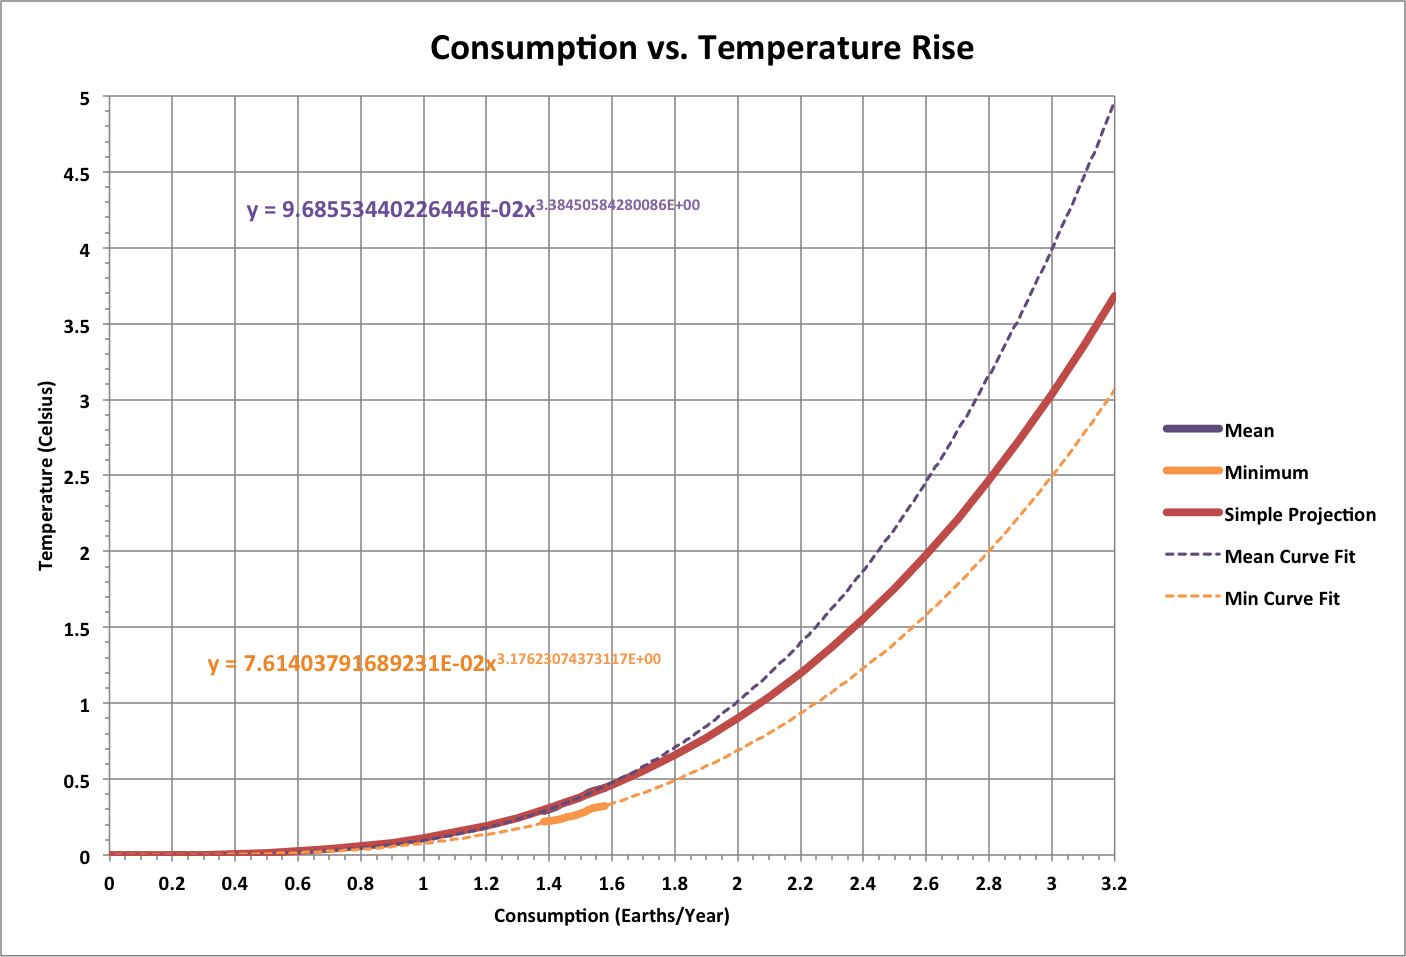
Temperature above the preindustrial level also varies exponentially with consumption. Here, the minimum and mean IPCC projections are curve fit to consumption.
In addition, Simple Projection uses an exponent of 3 to match the mean temperature:
Temp = 0.112406920714989 * Consumption3
~ Consumption3/9
where Consumption is in Earths/year.
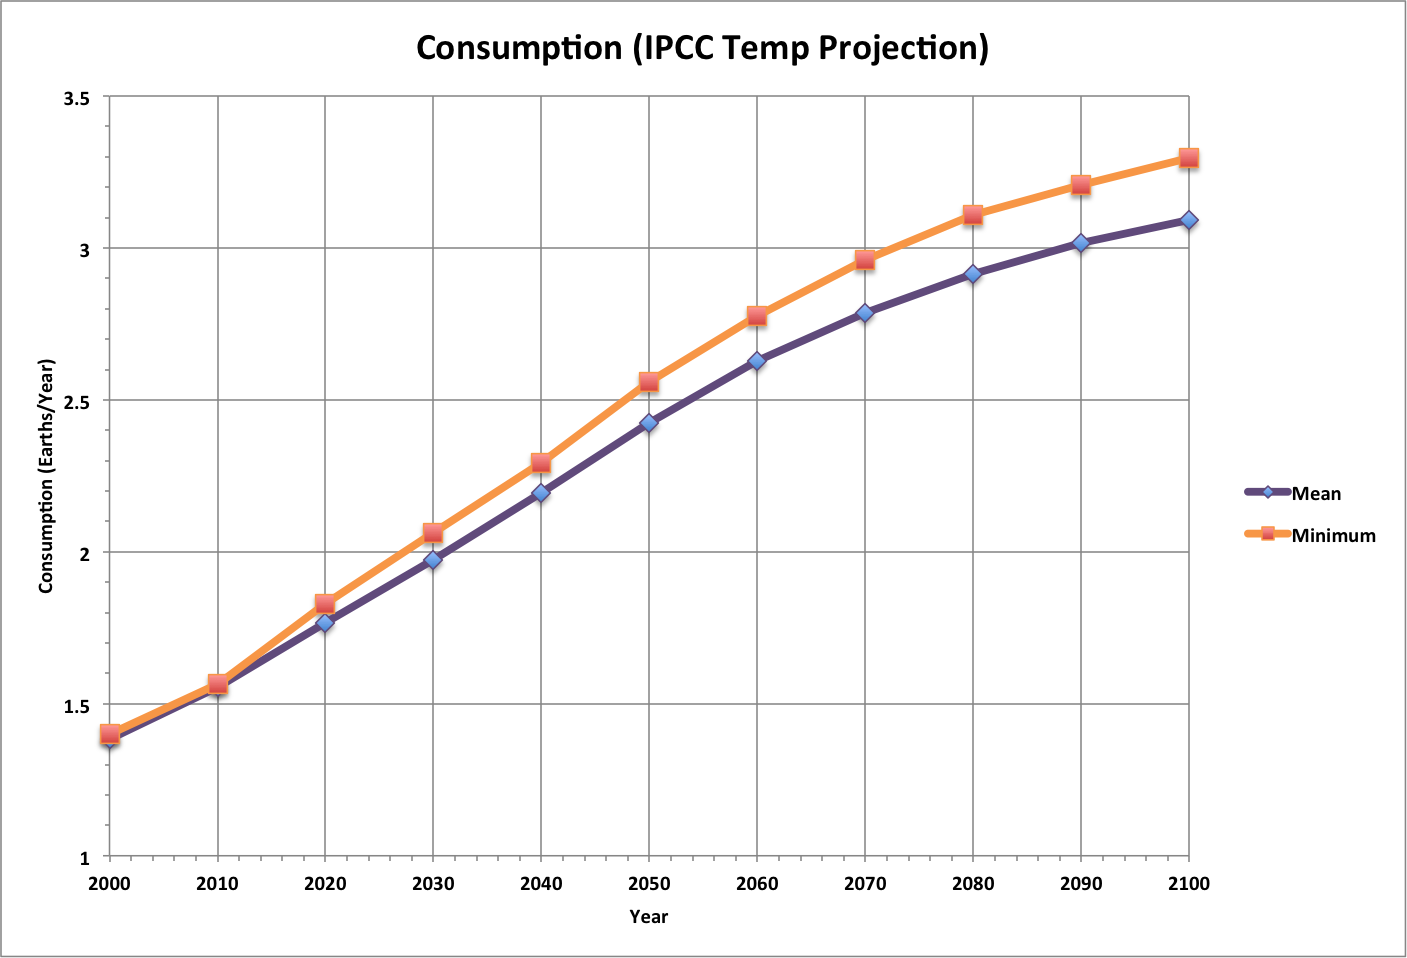
The mean IPCC projection of temperature is converted to consumption in this plot, showing that the highest limit corresponds closely to the consumption of all global ecological resources.
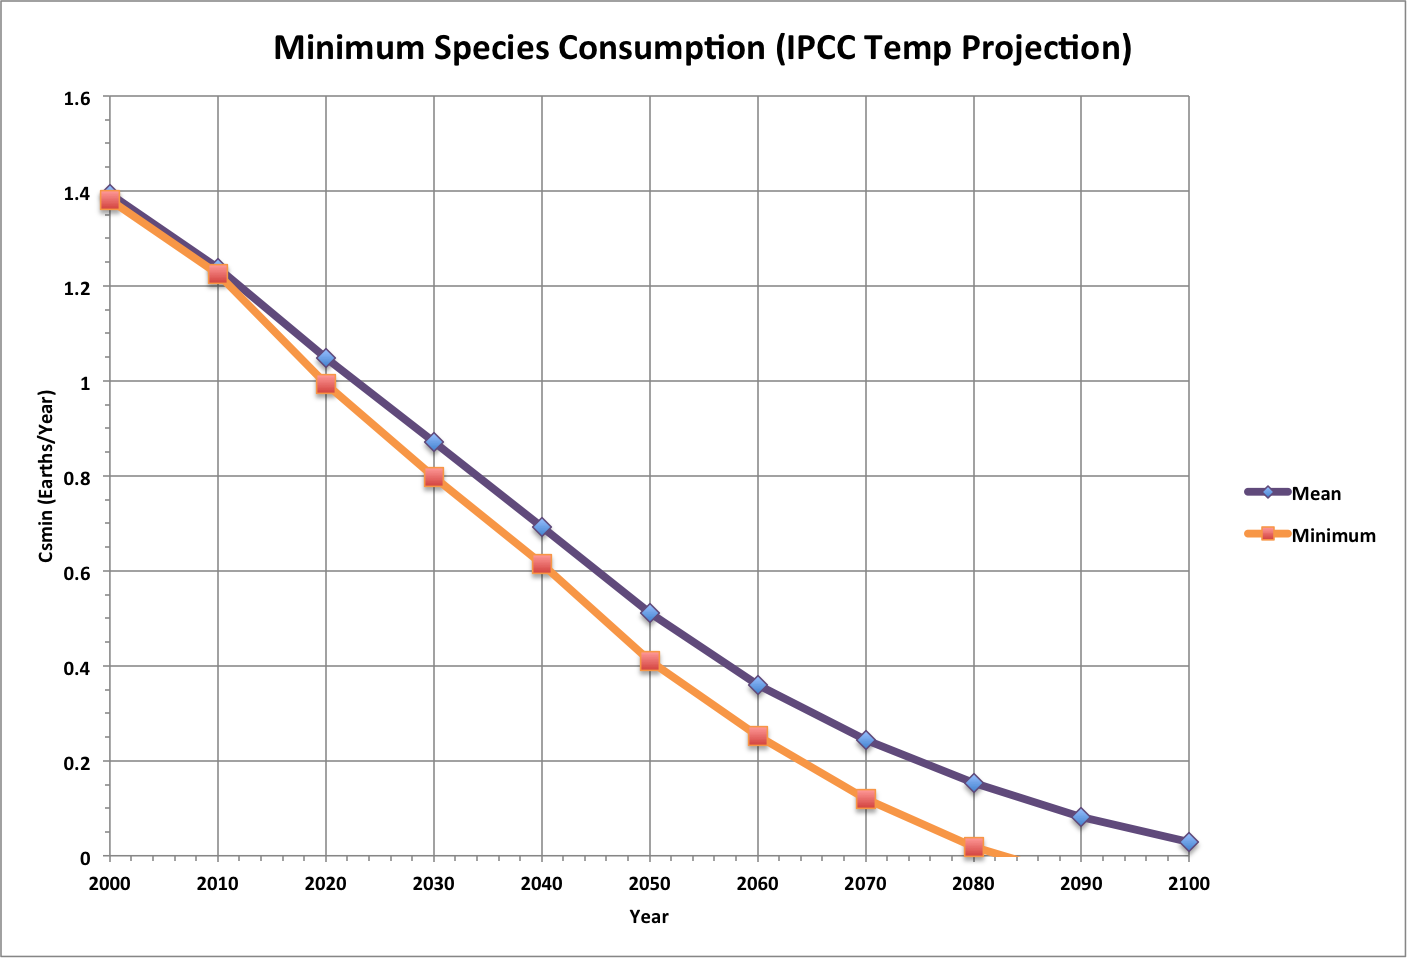
The minimum species consumption for the IPCC projection confirms that habitability will be compromised (Csmin < 1) in the range that as beyond adaptability for us and other species.
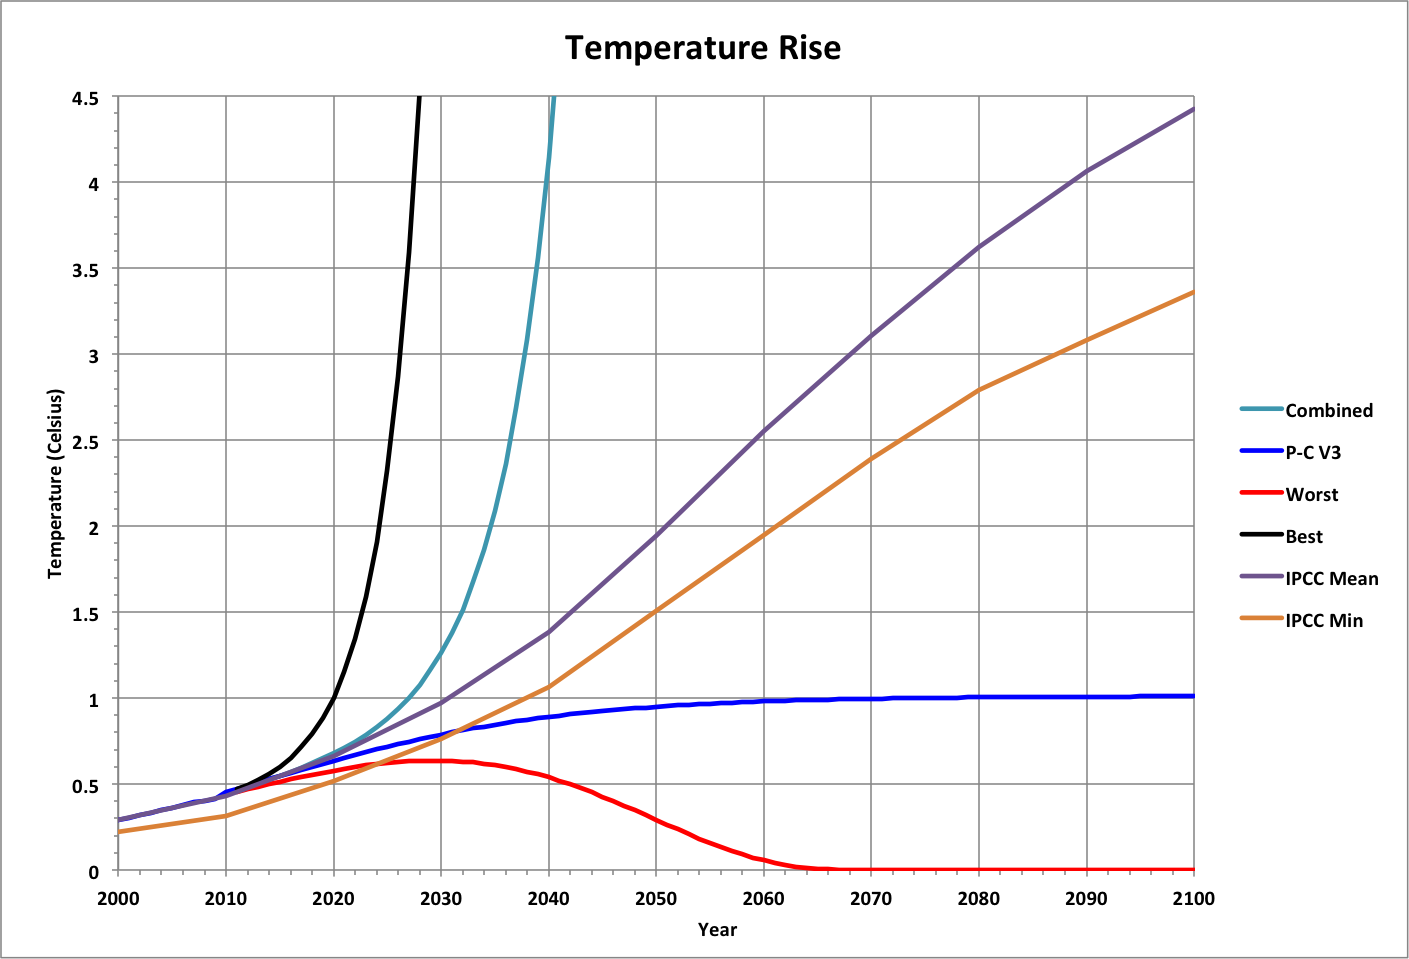
Temperature is plotted over time for each of the scenarios used in Compared Projections, based on the mean IPCC projection's relationship to consumption.
Note that persistence of emissions and feedback could cause it increase even as consumption decreases (in Worst, which is considered the most likely scenario).