Changes(Phase) 2021-2030
_2021-2030.png)
_2021-2030.png)
_2021-2030.png)
_2021-2030.png)
_2021-2030.png)
_2021-2030.png)
Related links:
- Consumption Drop Future
- Expected future and current simulation (Patreon.com)
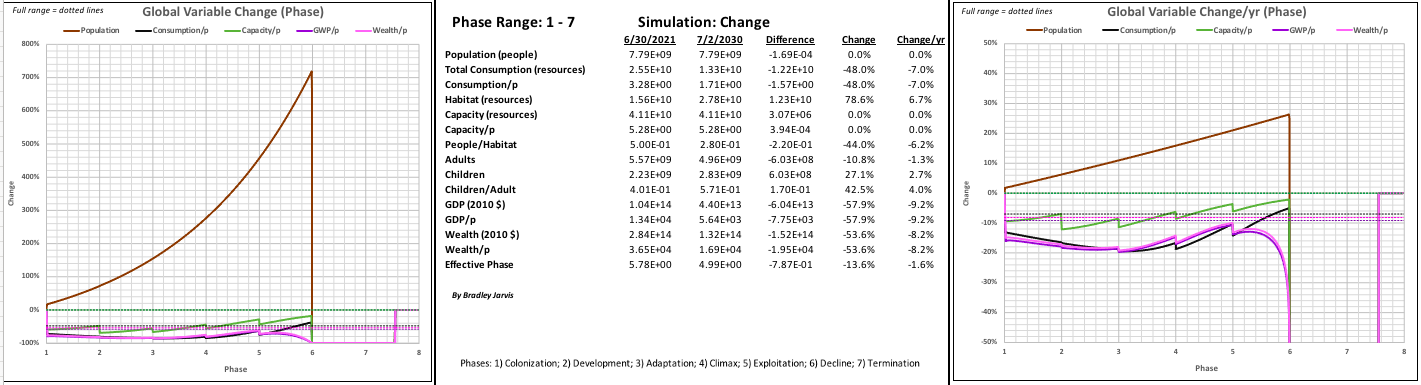
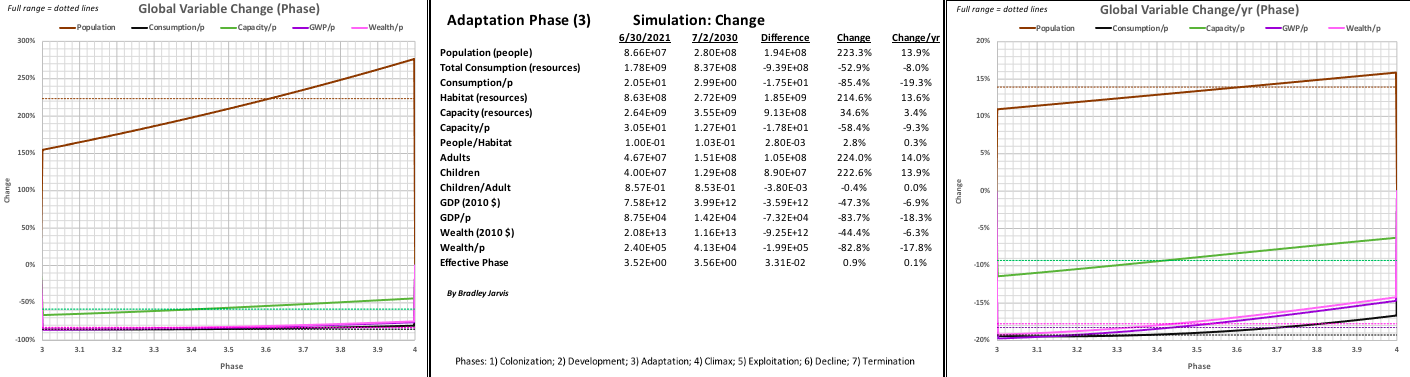
Changes(Phase) 2021-2030 |
| The following diagrams show how much the values of some global variables change from the start to the end of the transition 2021-2030. |
|
|
|
|
|
|
|
|
Related links:
|
| © Copyright 2020 Bradley Jarvis. All rights reserved. |