Gross World Product
Based on Half-Earth Hypothesis scenarios for 2015-2035 and world economics as defined in PCM Version 4, the following trajectories of Gross World Product (GWP) are derived in 2009 U.S. dollars, using the conversion
GWP = 3.57763284972246E-18 * ( Happiness * Population )2
Roll over the image to see normalized values.
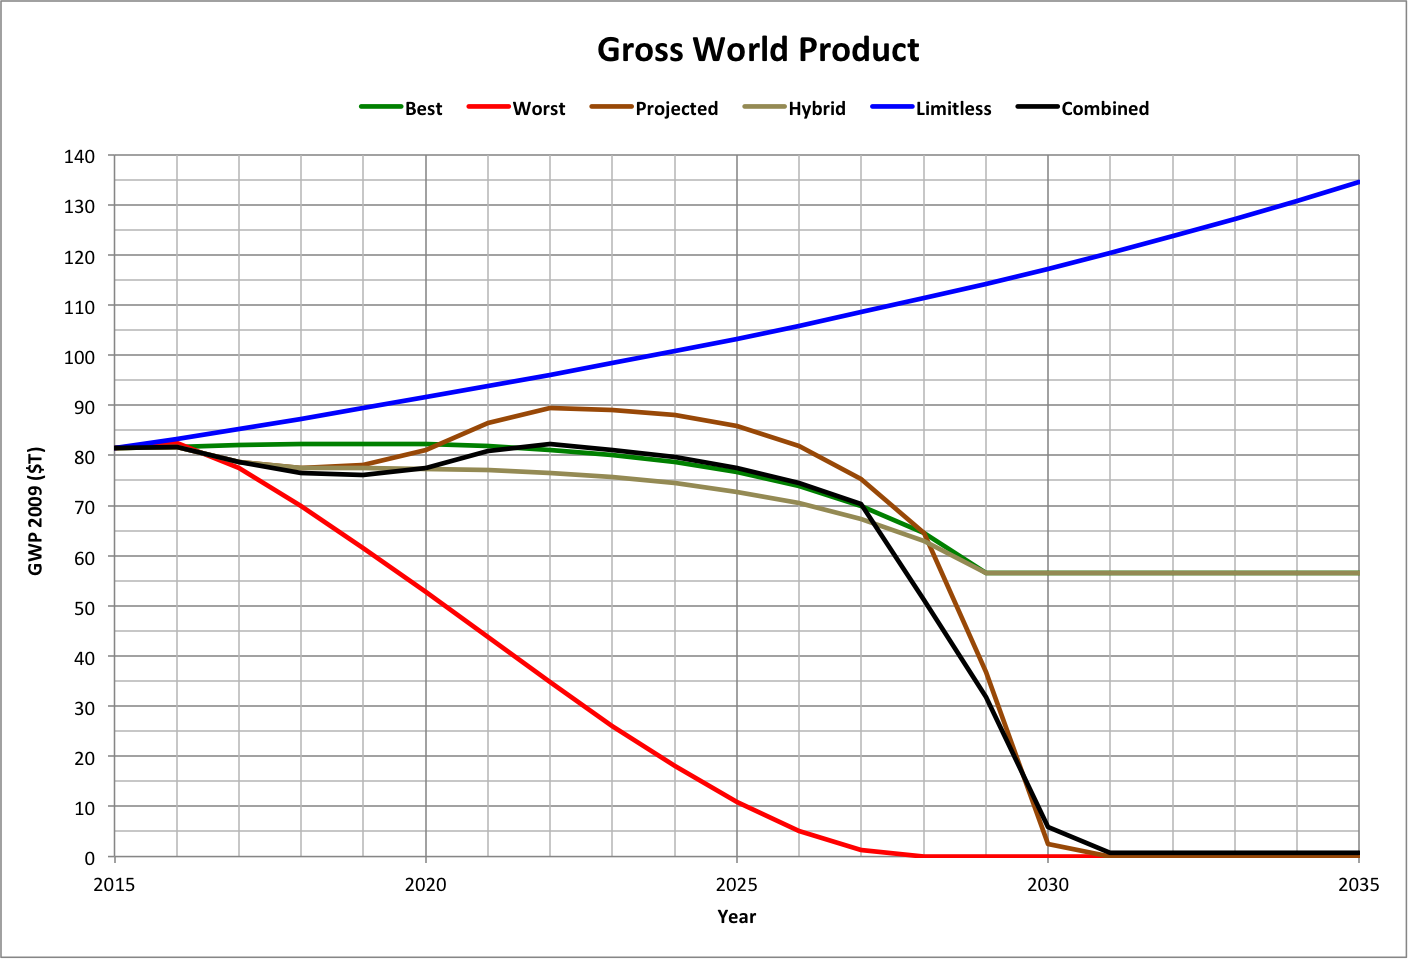
Note that this, like the other graphs, shows values for mid-year.
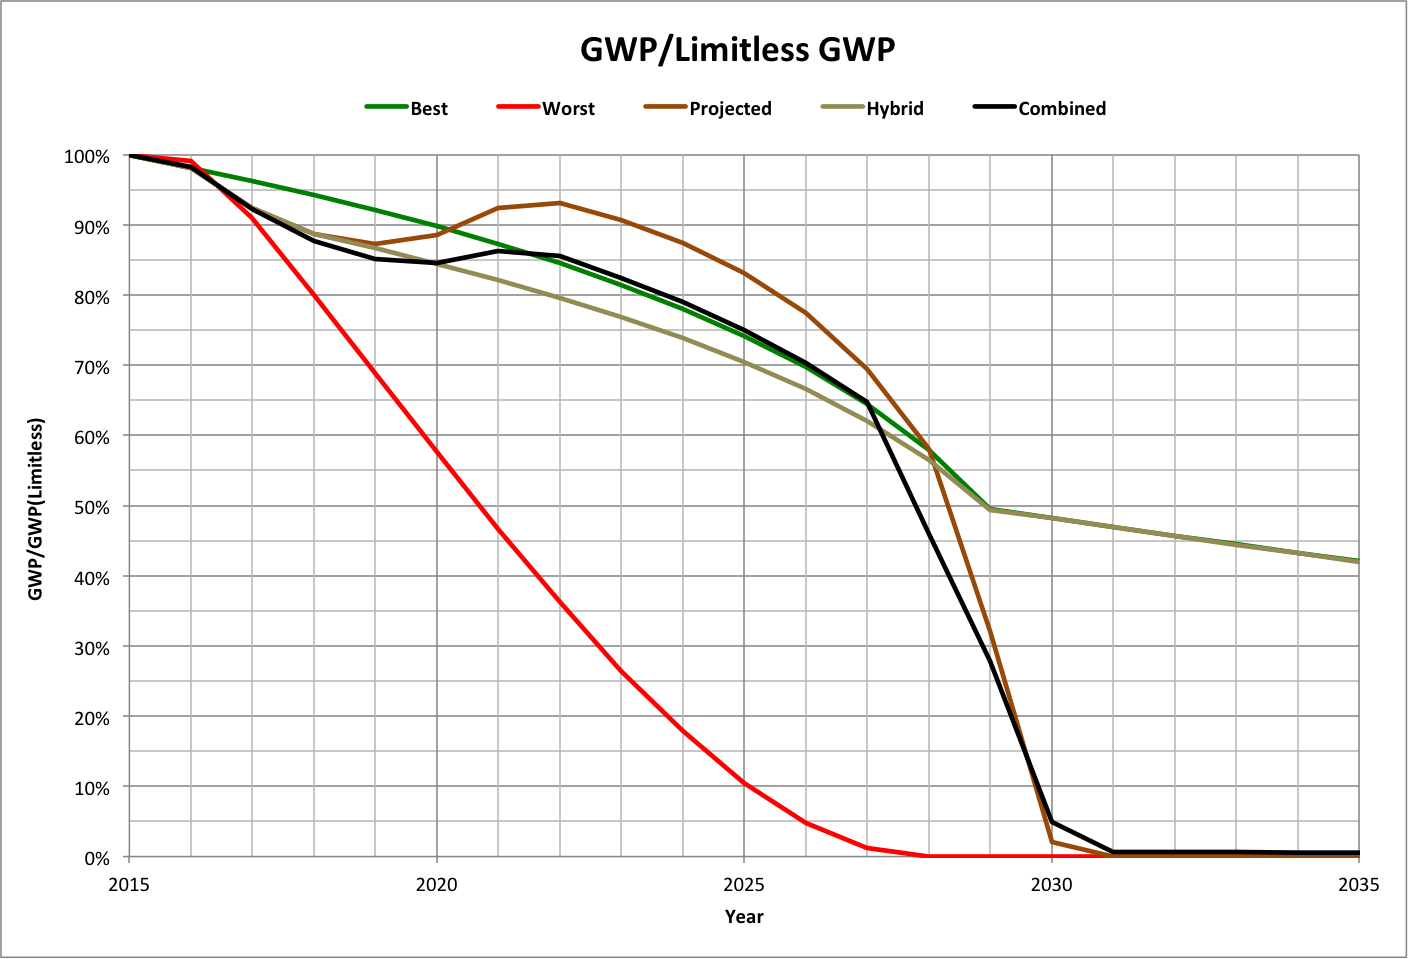
Using the limitless case as a reference, the following graph shows the trajectories of the remaining cases as fractions of what would be expected: