Normal Completion, p. 2
For background, see p.1.
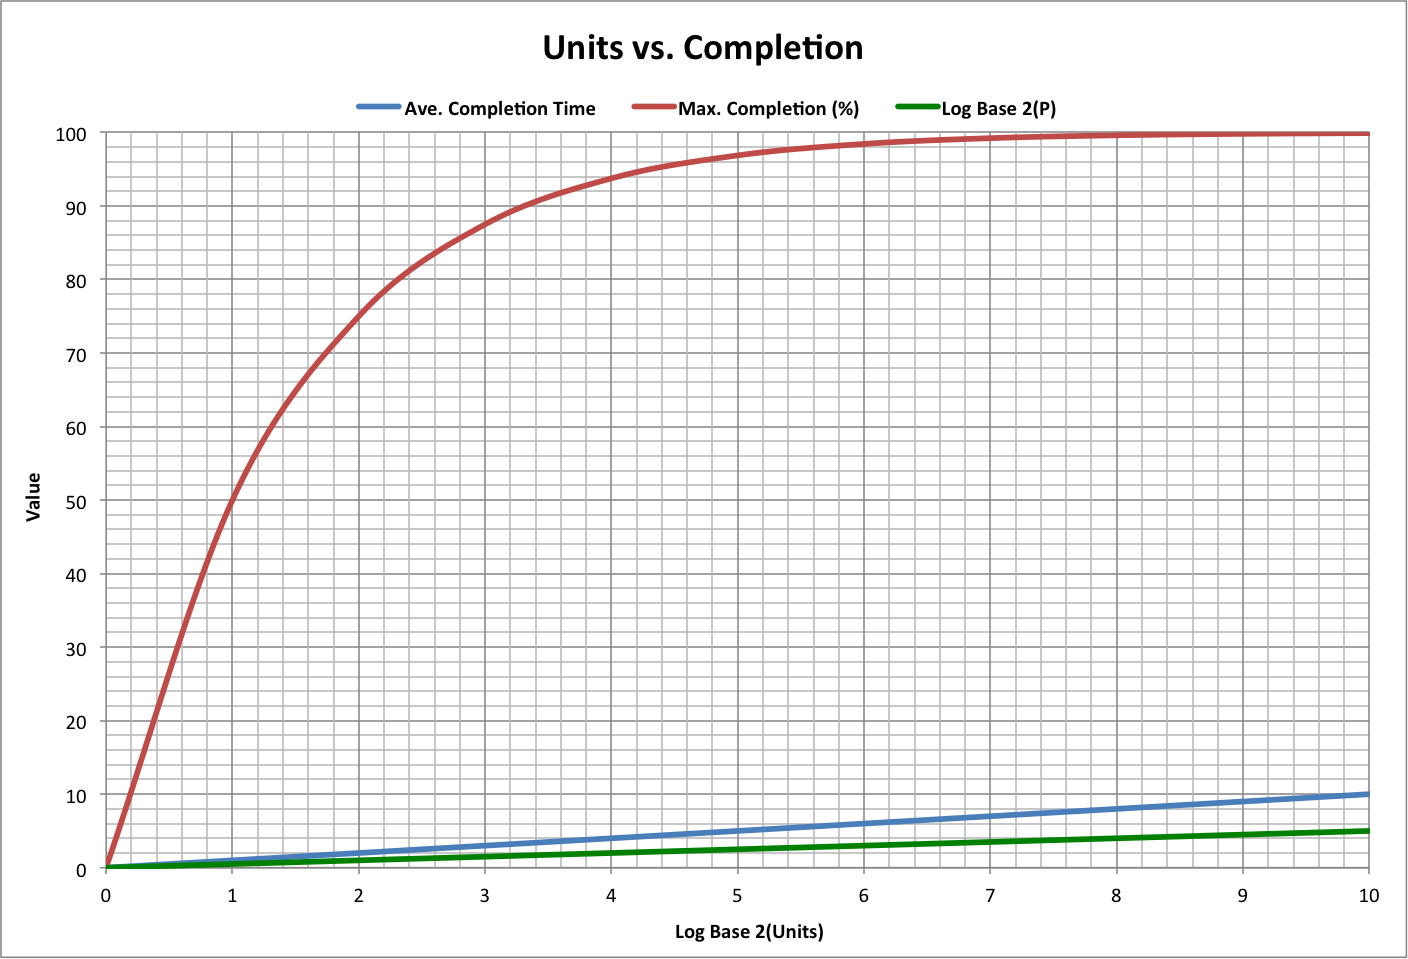
If a task consists of a number of units of completion (such as writing a page with 500 words, where words are the units), and the maximum completion consists of all but the last unit (which is the amount of uncertainty, or resolution, of the task), then:
Maximum Completion = 1 - 1 / Units = Efficiency(Completion Time = 1)
Average Completion Time = log2(Units)
where:
- Completion Time is in terms of best-case time
- Average Completion Time is completion time for the average of the population, with Efficiency = 0.5
If the task involves interactions between P actors (as a measure of its complexity), then:
Interactions = Units = P2
P = log2(Units) / 2
These relationships are graphed below. Of particular interest is the fact that the completion time for 82% completion is half the completion time for 97% completion, which are critical peak values in the Half-Earth Hypothesis.
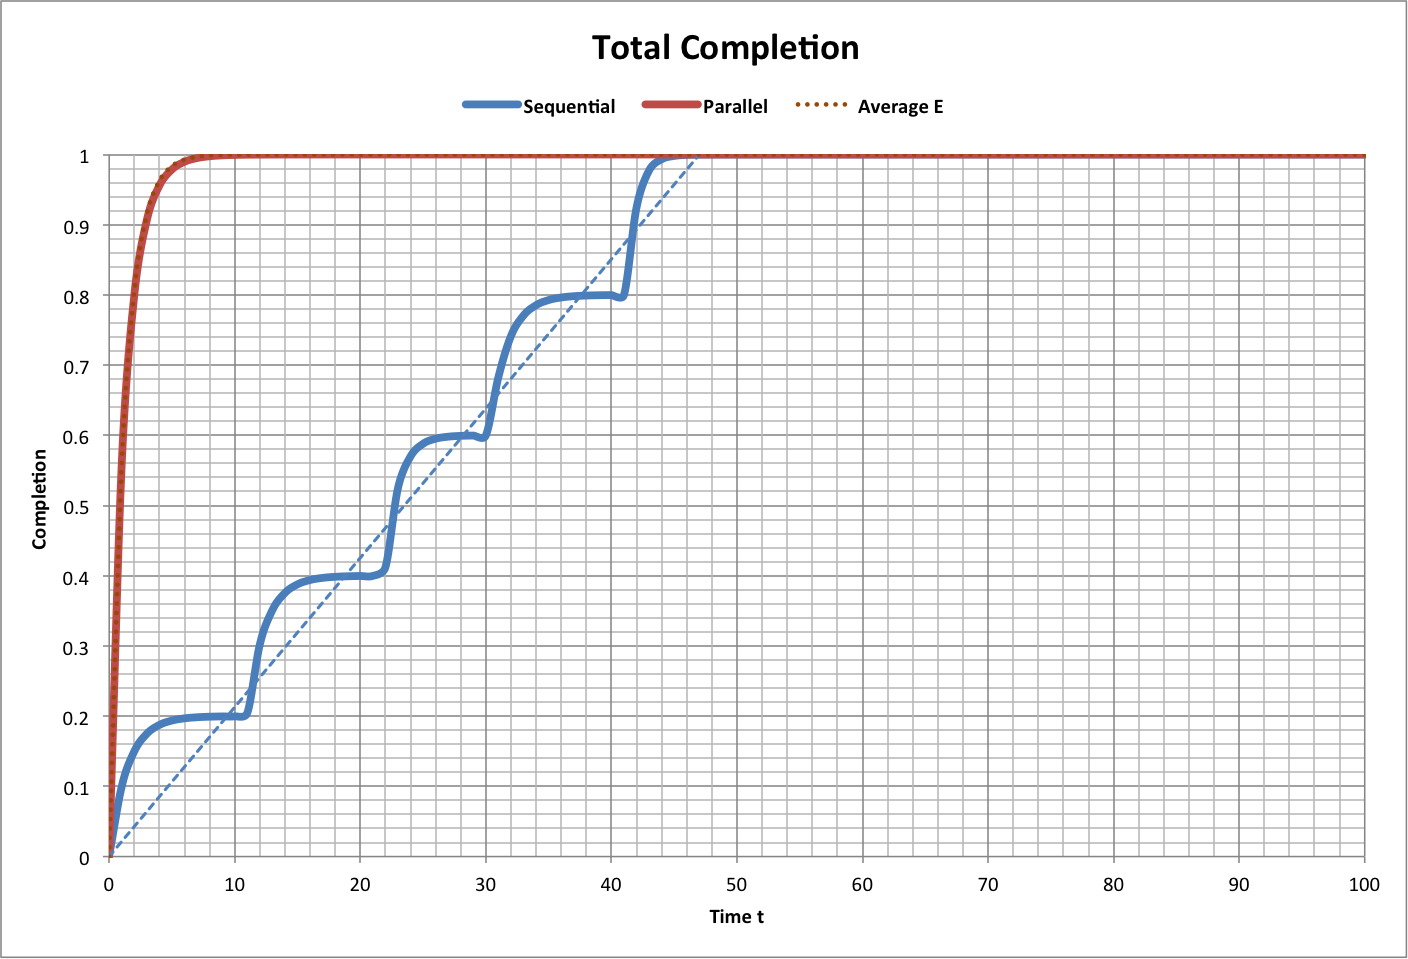
Tasks can be done sequentially (one after the other) or in parallel (at the same time). The following example shows five tasks done either way, each with its own efficiency and the same number of units (which may not always be the case in reality).
Note that the progress of sequential tasks approximates a line, while the progress of parallel tasks approximates completion with an efficiency equal to the average of each of the tasks. Also, the completion time for parallel tasks (equal to the sum of the completion times for each of the tasks) is much greater than for parallel tasks.
In reality, the tasks may be done in a combination of these two approaches, where sequential tasks may begin at times other than the estimated completion times for preceeding tasks.
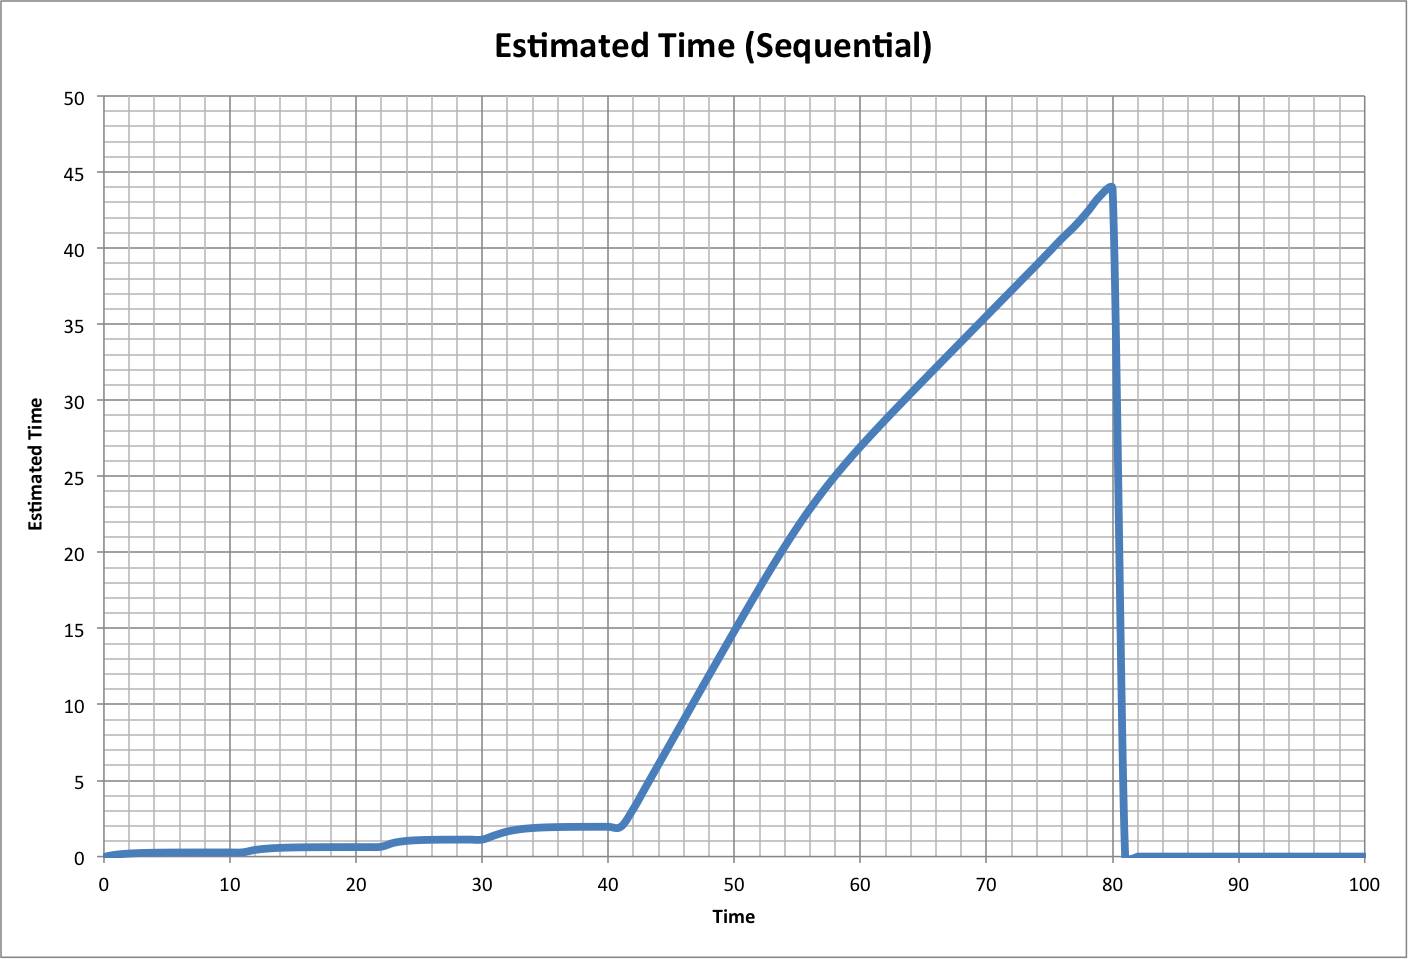
Compared this to the following graph of estimated time for historical per capita ecological footprint (F), global ecological footprint (Global F), and life expectancy (L).
Life expectancy appears to be a set of sequential tasks, which appear to have been complete in 2011 (life expectancy actually declined). Footprint and Global Footprint show multiple peaks and declines, suggesting failure of tasks to remain complete. The fact that all the final peaks occur at the same time suggests that it may reflect completion of all tasks.
_close.png)
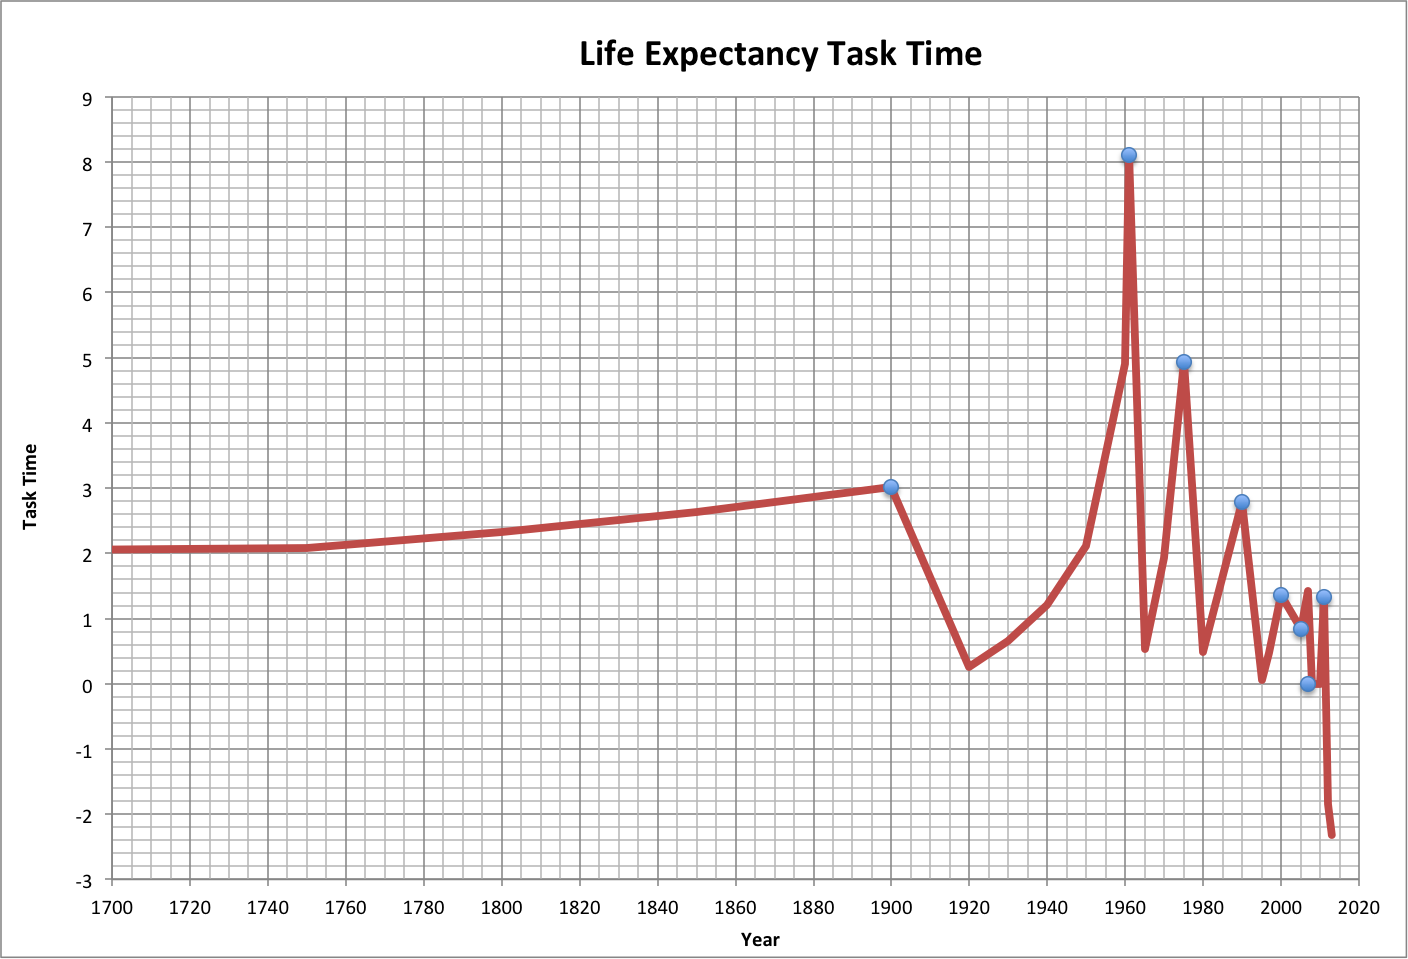
Assuming that inflection points on task time (as on the graph above, but expanded to the full period of civilization) closely correspond to the end of one task and the beginning of another, life expectancy appears to be a sequence of eight tasks. Each had the goal of achieving half the difference between maximum life expectancy (70.76 years) and the life expectancy at the end of the previous task.
The following graph shows the amount of task time per task, with blue dots marking the ends of the tasks.