Temperature
Updated 10/5/2015
Cumulative carbon emissions from fossil fuels (the total amount in the atmosphere) varies linearly with global footprint (Fe), as shown in the following graph. The global temperature change since preindustrial times (the "temperature anomaly") for land and sea varies linearly with emissions, as shown in the graph after that.
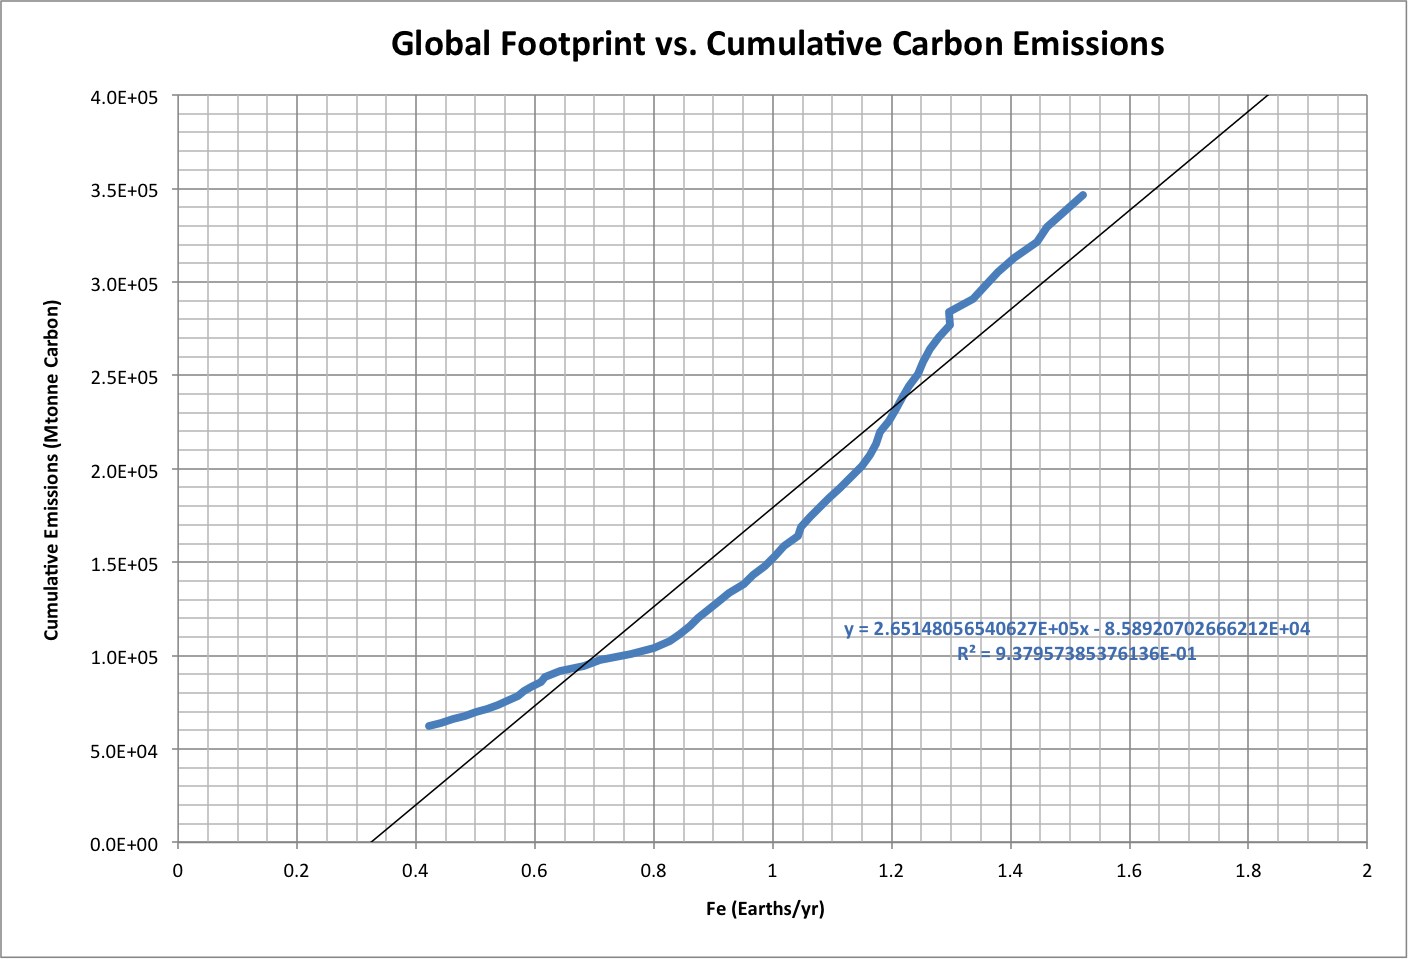
Cumulative total emissions since 1750, plotted for the years 1950-2008 using global ecological footprint values derived for the Half-Earth Hypothesis. Emissions data source: Source: Tom Boden Gregg Marland and Bob Andres (Oak Ridge National Laboratory).
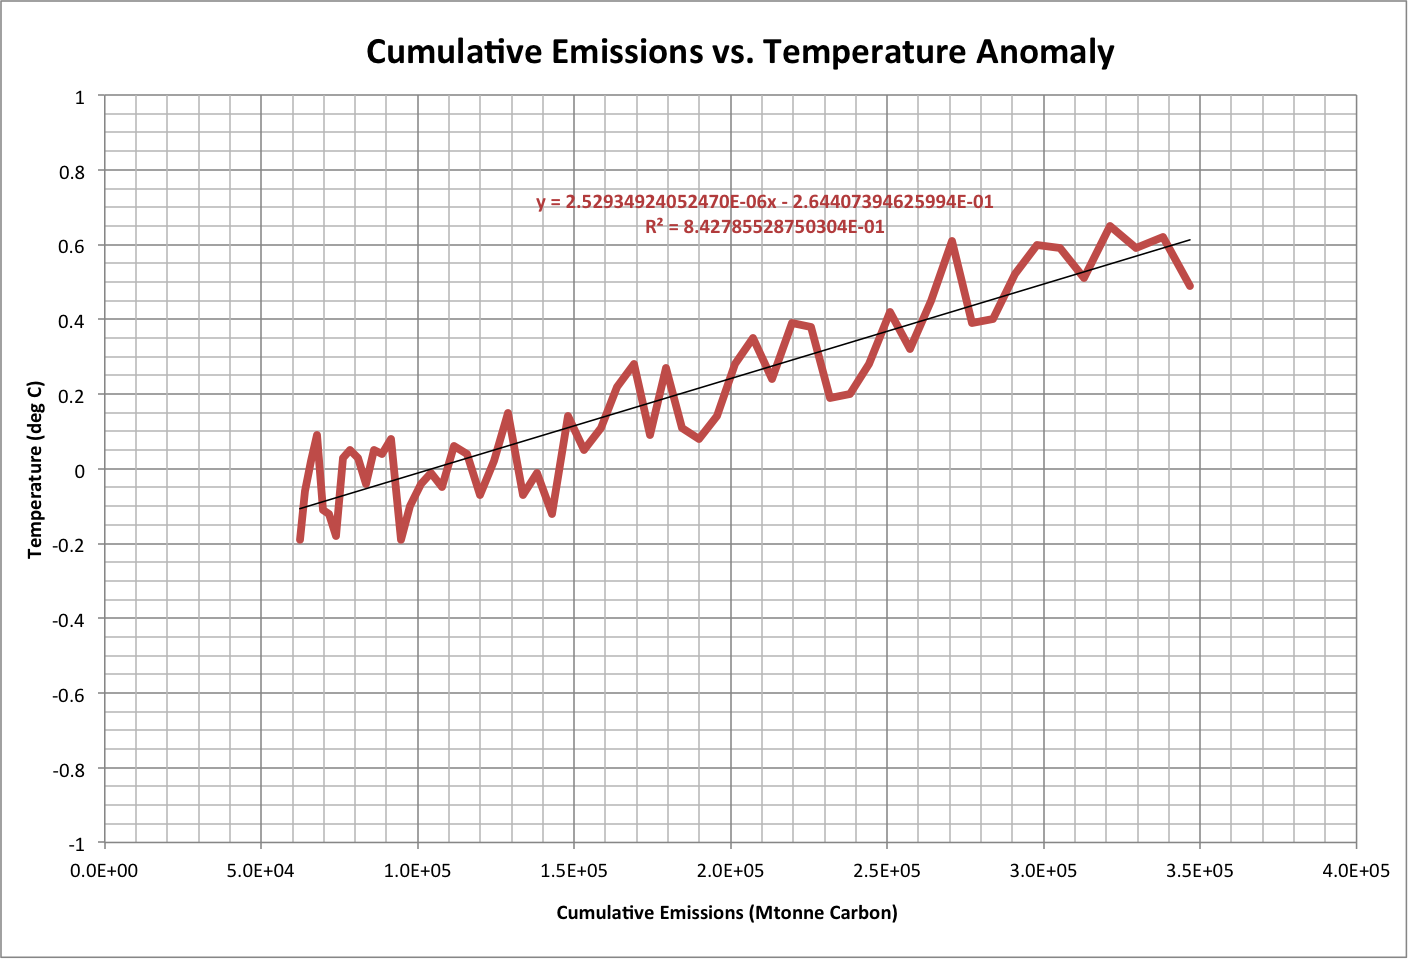
Temperature data source: Global Annual Temperature Anomalies (Land + Ocean), 1880-2014; R. Ruedy, M. Sato, K. Lo.
The error statistics for 1950-2008 data are:
| Variable | Mean | Standard Deviation |
| Cumulative Emissions (Mtonnes Carbon) | -0.6 | 21257.1 |
| Temperature Anomaly (degrees C) | 0.00 | 0.12 |
Emissions and temperature are calculated as follows:
| Variable | Conditions/Description |
| EmissionsFe = 265148.056540627 * Fe - 85892.0702666212 |
NOTE: If EmissionsFe is less than the value in the previous year, then it is set equal to the value in the previous year. |
| EmissionsRdrop = 265148.056540627 * Rdrop - 85892.0702666212 |
|
| EmissionsRdrop = 0 |
|
| Temperature = 0.0000025293492405247 * Emissions - 0.264407394625994 |
|
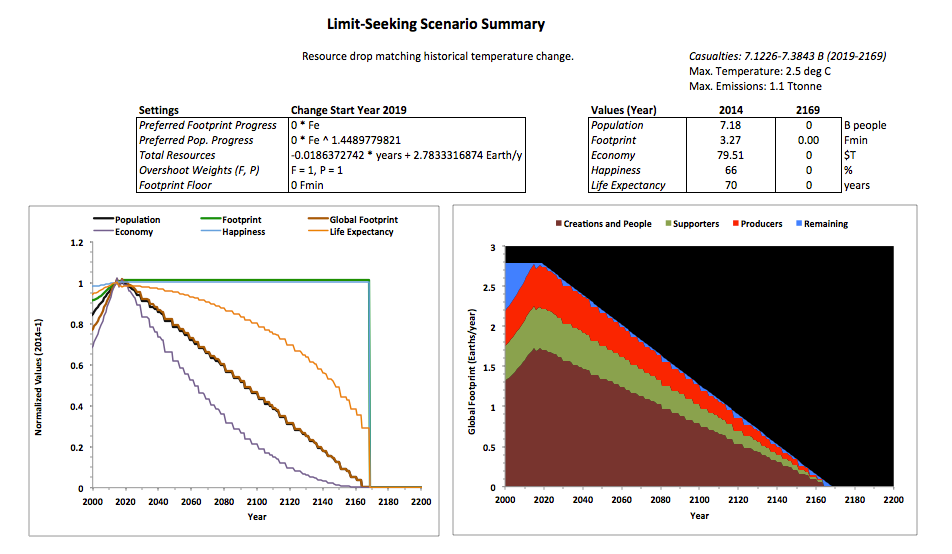
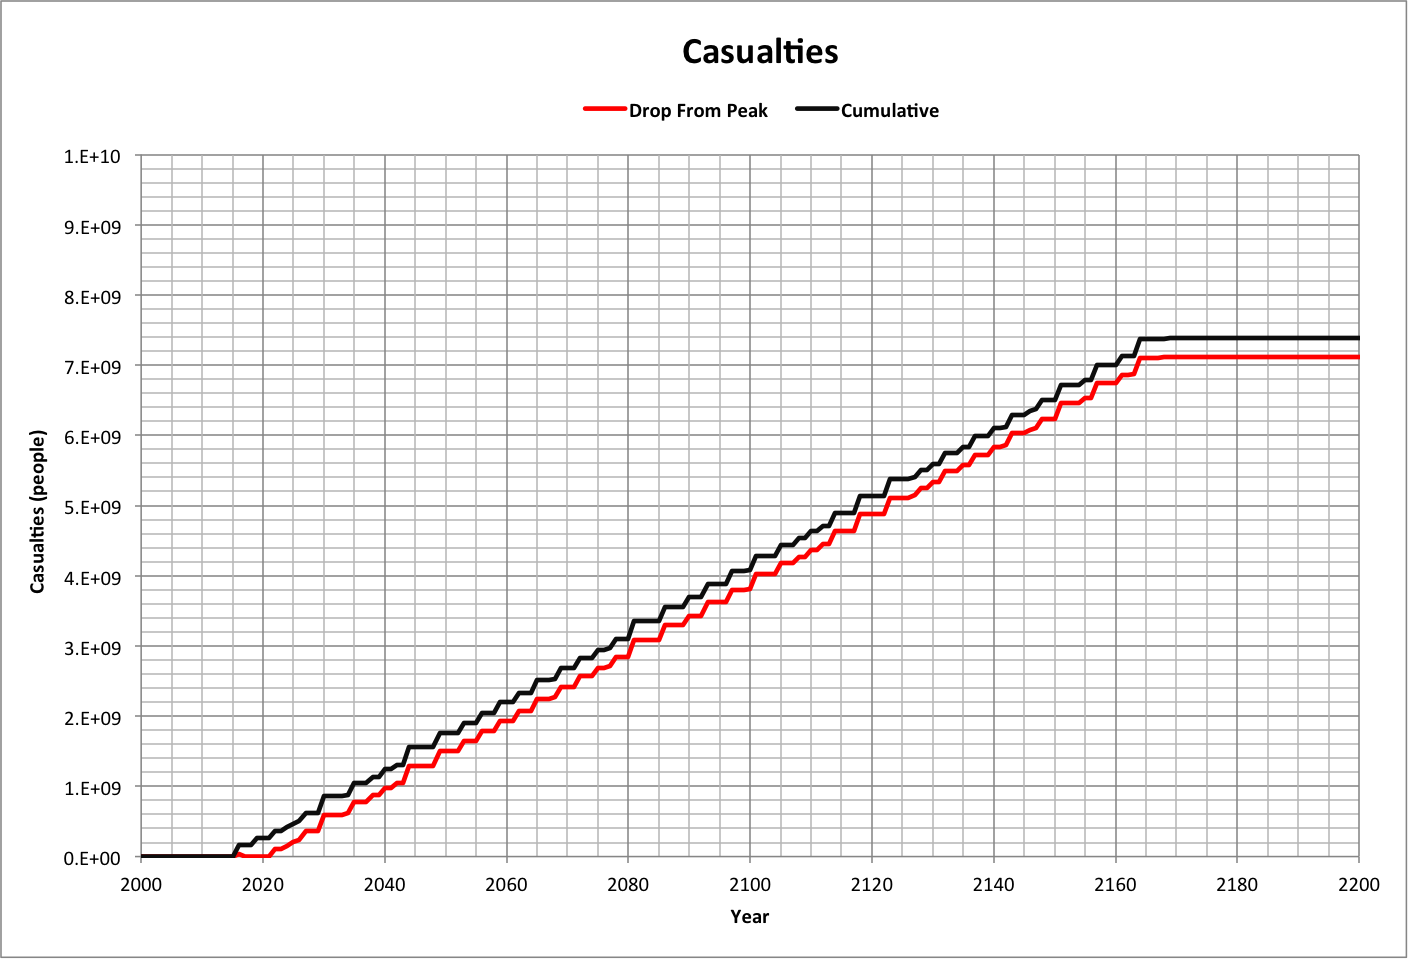
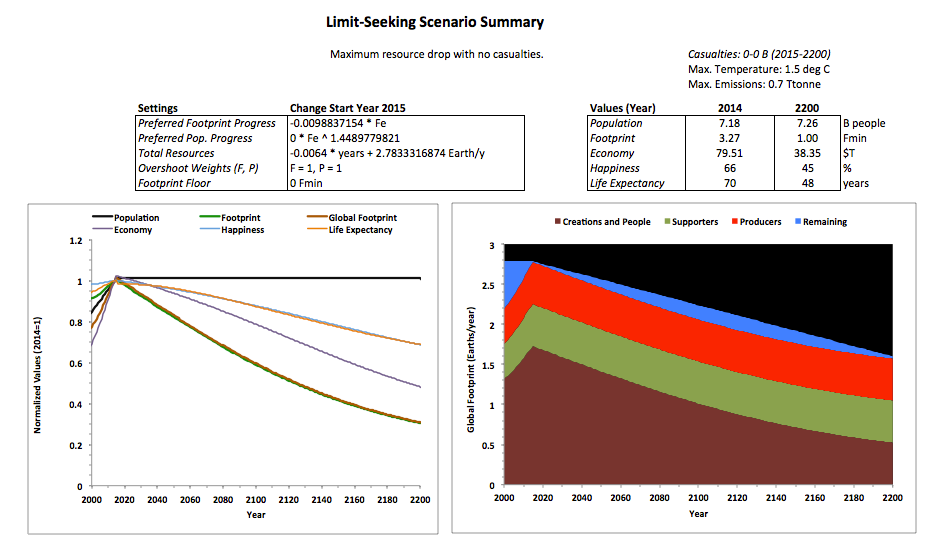
The following summary, based on the limit-seeking case, shows the highest resource depletion rate that can be adapted to, with no casualties until beyond 2200. Unfortunately, population is doomed to crash (fall to zero) at some point if the resources continue to decline, since the footprint will be forced below the minimum needed to survive.
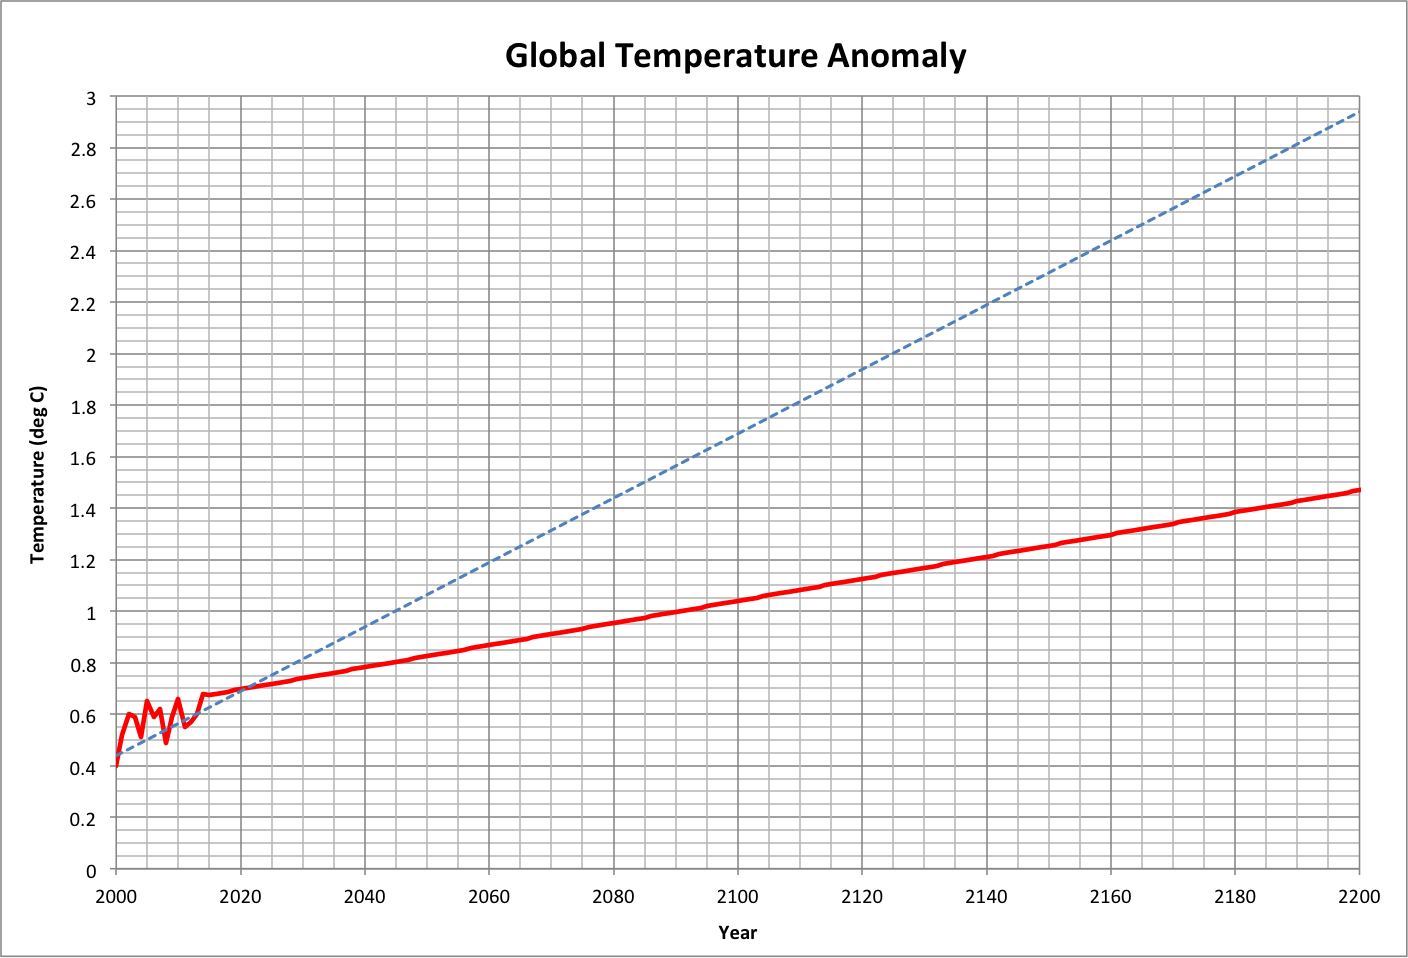
In the graph below the summary, the corresponding temperature anomaly is shown (red) along with a linear extrapolation (dotted blue line) from historical values (1950-2014).
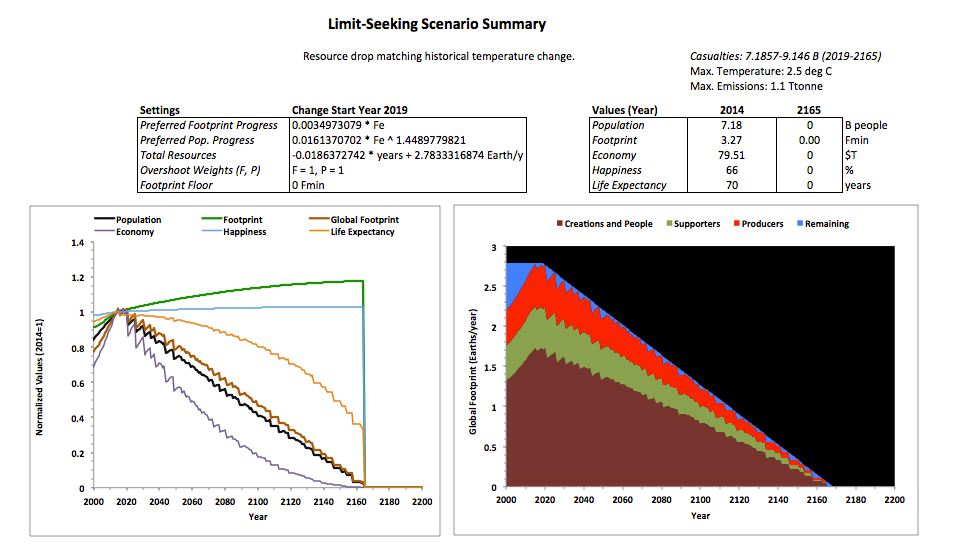
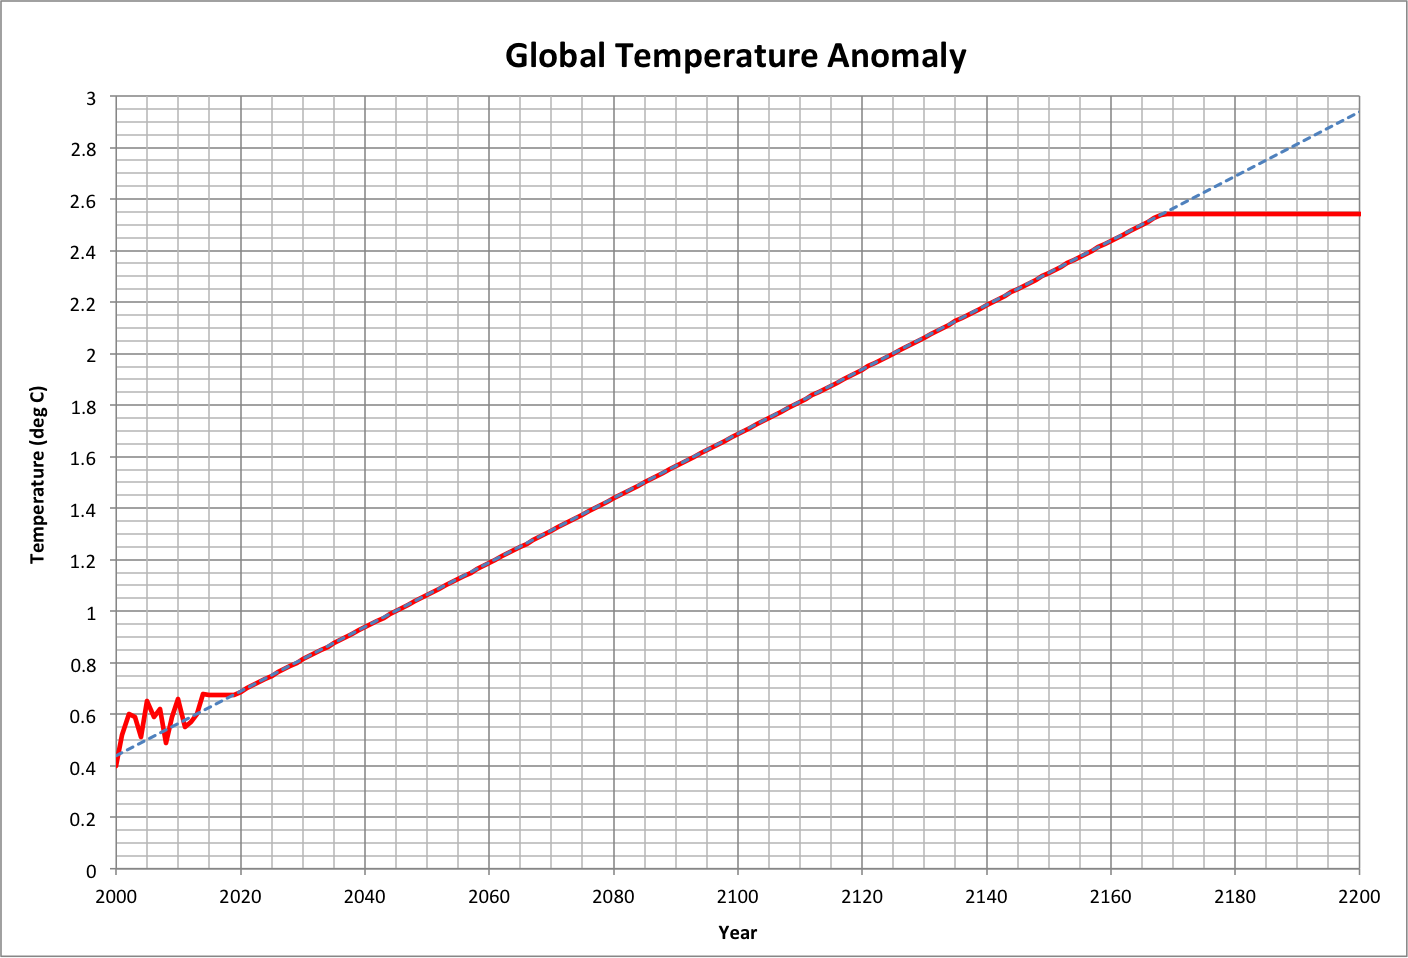
If the historical temperature extrapolation is assumed for future temperatures, then global warming will begin affecting total resources in 2019. The result is summarized below, where default behavior (population and consumption limit-seeking) is applied. Temperature and casualties are displayed in the following two graphs.
Note the values for maximum temperature anomaly (2.5 degrees Celsius, currently 0.7 degrees) and cumulative emissions (1.1 teratonnes of carbon, currently 0.4 teratonnes) in this updated version of the summary. The emissions reported include the amount due to consumption and the effective amount contributed to resource decline.

The following graph compares the population trajectories for the default case and the global warming case above.

The following summary and graphs show that the population crash can only be delayed four years, by having no progress in population or consumption.