Alternate Sratio Relationships
Although Timeline 2 (TL-2) is the primary timeline, deviations from the relationships used in that timeline are used in other timelines. These apply to the species ratio (Sratio) as described below.
The following graph shows three approximations to Sratio as a function of time. They are assigned to timelines as follows:
- Green (-5000 <= year < 1650)
- Blue (1650 <= year < 1947)
- Purple (year >= 1947)
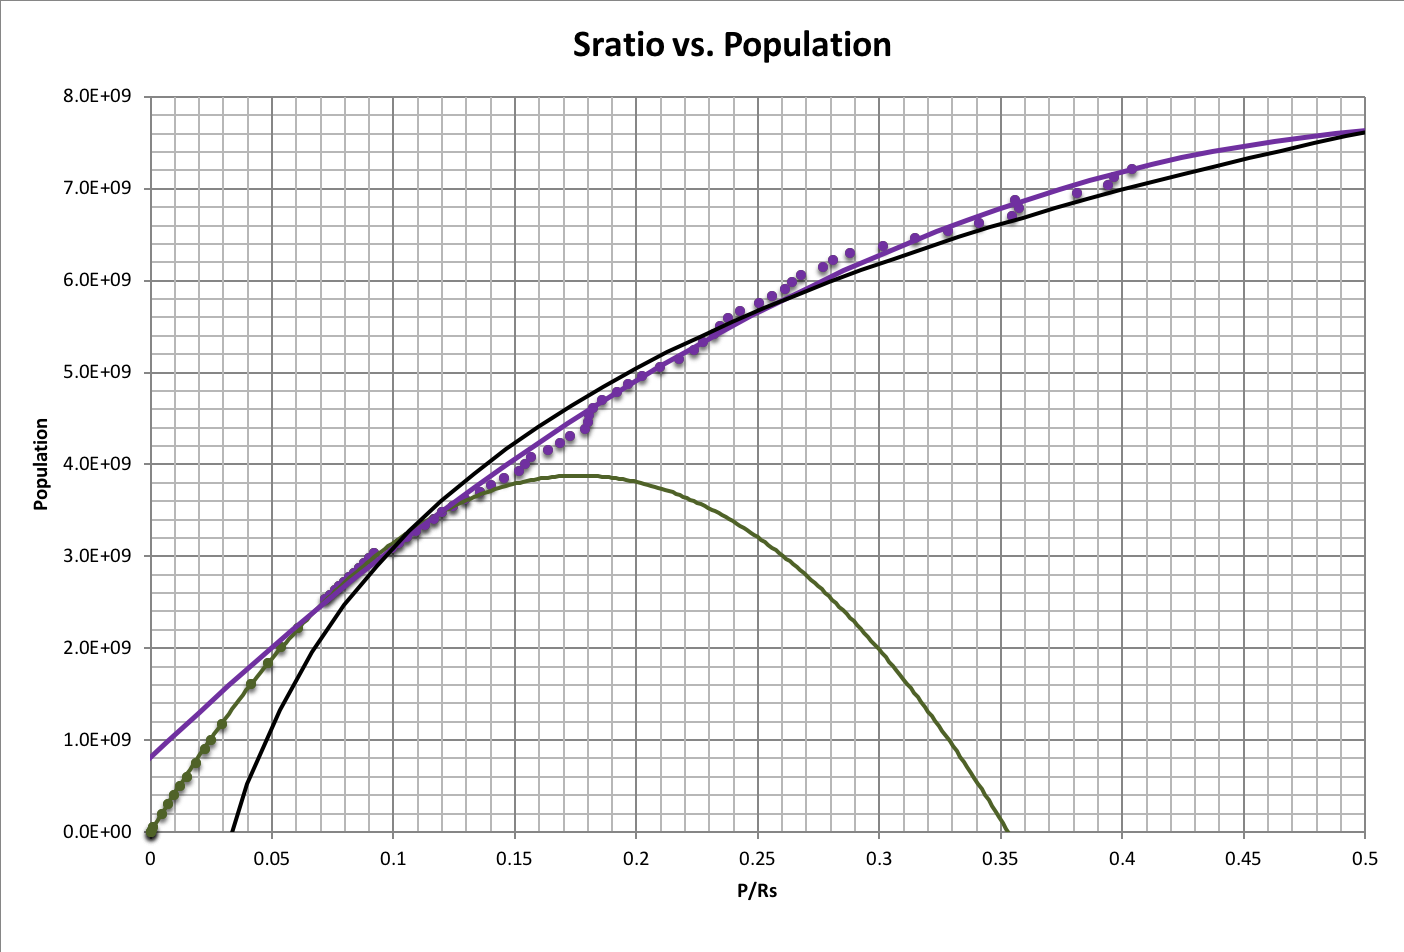
The following graph shows approximations to population as a function of Sratio. These are assigned to timelines as follows:
| Green | Sratio < 0.073 | TL-2, TL-4, Fix |
| Green | All Sratio | TL-3 |
| Black | Sratio > 0.25 | TL-5 |
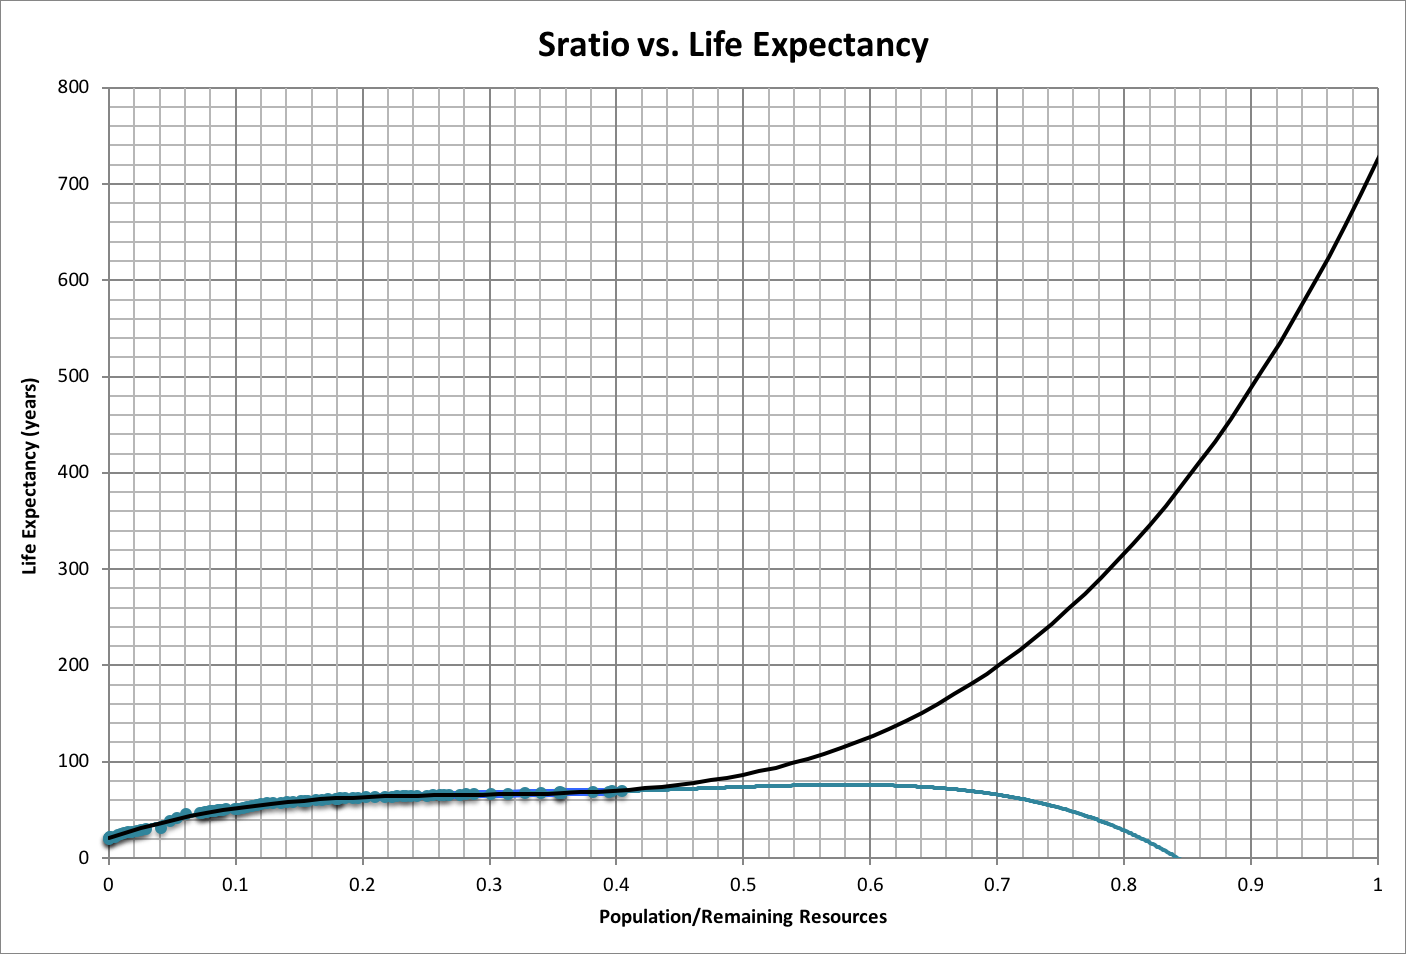
The following graph shows two approximations of life expectancy as a function of Sratio. The black curve is assigned to TL-5, and the blue curve is assigned to all other timelines.
See also: