Backcast Version 2
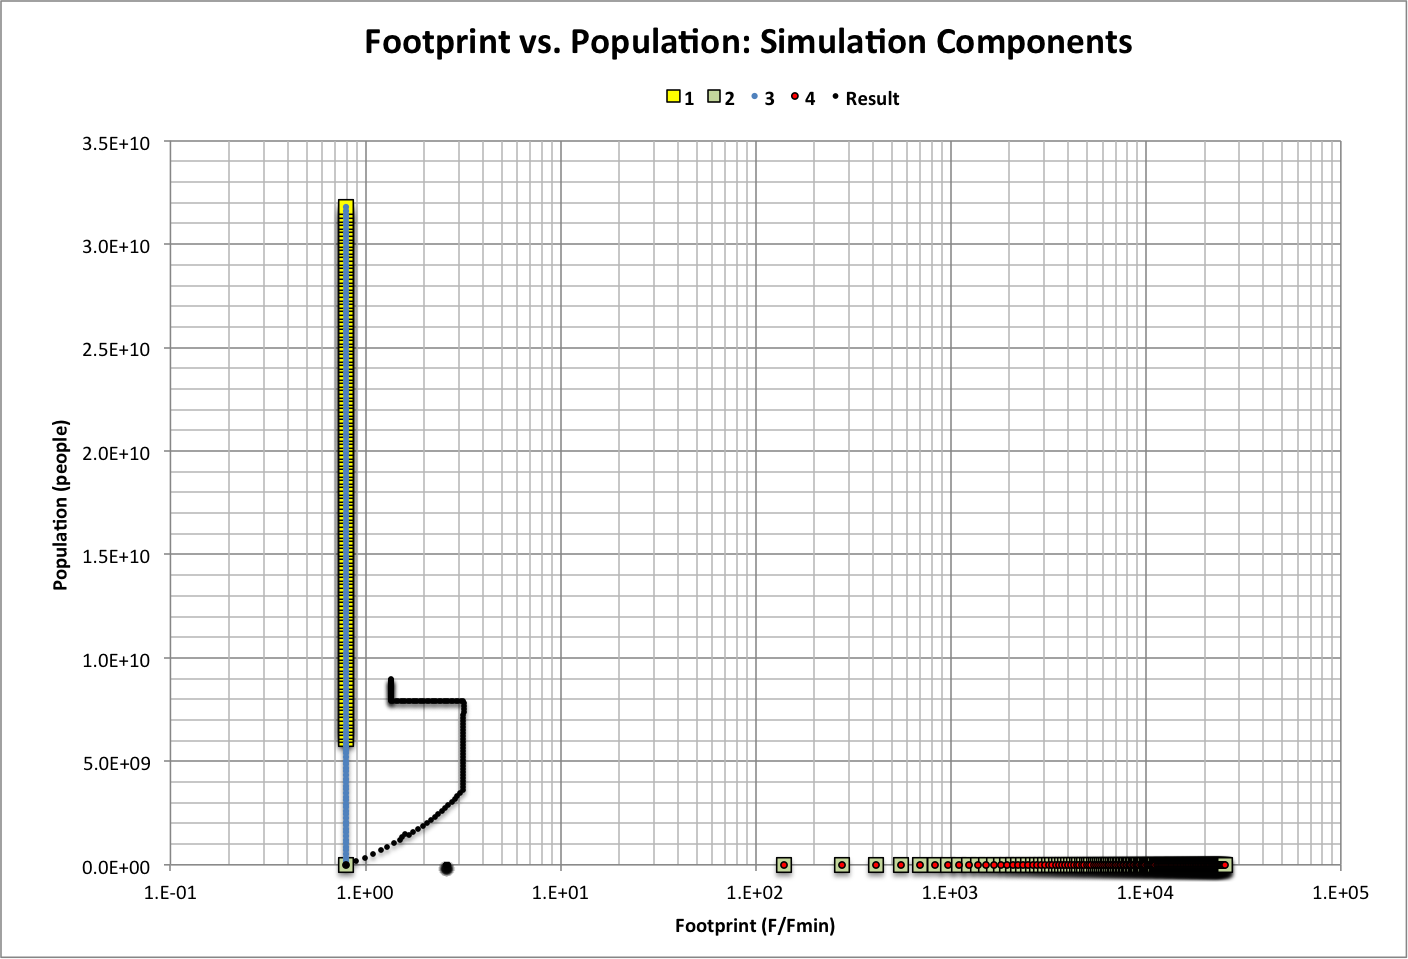
Here, F is the average per-capita ecological footprint in Earths/person/year and Fmin is the minimum ecological footprint. Points on the graph represent a value of global footprint (Fe = P * F, where P is population), separated in each simulation by a difference of 0.01 Earths/year. Simulations and the result all start at year 10000 B.C.E., when P = 1E+06 people and f0 = F0 / Fmin = 7.97E-01.
The simulations are calculated as follows:
| Simulation 1 | f1 = f0 P1 = Fe / (f1 * Fmin) Maximum Limits:
|
||||||
| Simulation 2 | f2 = (Fe / P2) / Fmin P2 = P0 Maximum Limits:
|
||||||
| Simulation 3 | f3 = f0 P3 = Fe / (f3 * Fmin) Maximum Limits:
|
||||||
| Simulation 4 | f4 = (Fe / P2) / Fmin P4 = P0 Maximum Limits:
|
The result is calculated using two equations:
Presult = (a1 * P1 + a2 * P2 + a3 * P3 + a4 * P4) * (fresult > 1)
+ (a1 * P1 + a2 * P2 + a3 * P3 + a4 * P4) * fresult * (fresult <= 1)
fresult = a1 * f1 + a2 * f2 + a3 * f3 + a4 * f4
The weights ( an ) and maximum global footprints (Felow and Fehigh) are chosen to best fit the result to historical data:
a1 = 1.66546503E-01
a2 = 7.14484E-04
a3 = 8.32732517E-01
a4 = 6.49531E-06
Felow = 2.5E-01
Fehigh = 2.972069653
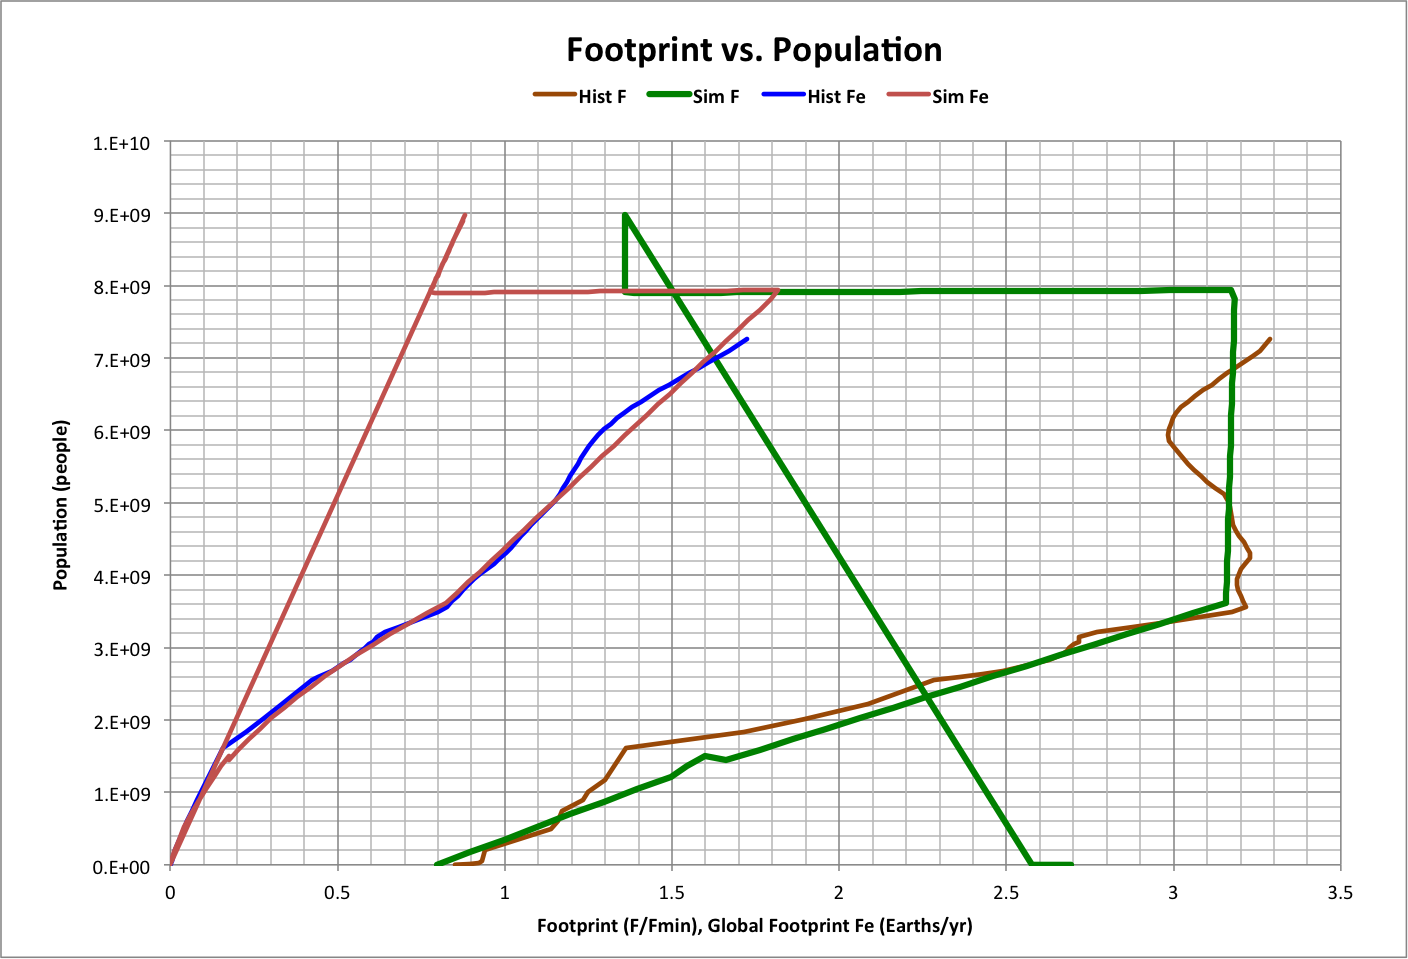
The resulting values of f , P, and Fe are shown below along with historical data and includes a futurecast with no global warming:
Time t in years between two values of Fe can be estimated using the following relationships:
Fe < 7.67E-01 Year < 1967 |
Pt = Pt-1 * (1 + Popratet)t Popratet = -0.0204562252684025 * Fet^2 + 0.0377807174089065 * Fet + 0.00141394695249756 Year = Year(P) = t - 2008 |
Year(Fe) >= 1967 Year(Fe) < = 2006 |
tn - tn-1 = (Feration - Feration-1) / (0.01 * Fen) Feratio = Fe / Fehigh Year(Fe) = t + 1797 Year(Fe) = Year(P) YearsFen = (tn - tn-1) / ( Fen - Fen-1) AVERAGE(YearsFe) = 52 |
| Year > 1967 | Yearn - Yearn-1 = AVERAGE(YearsFe) * ABS( Fen - Fen-1 ) where ABS is the absolute value |
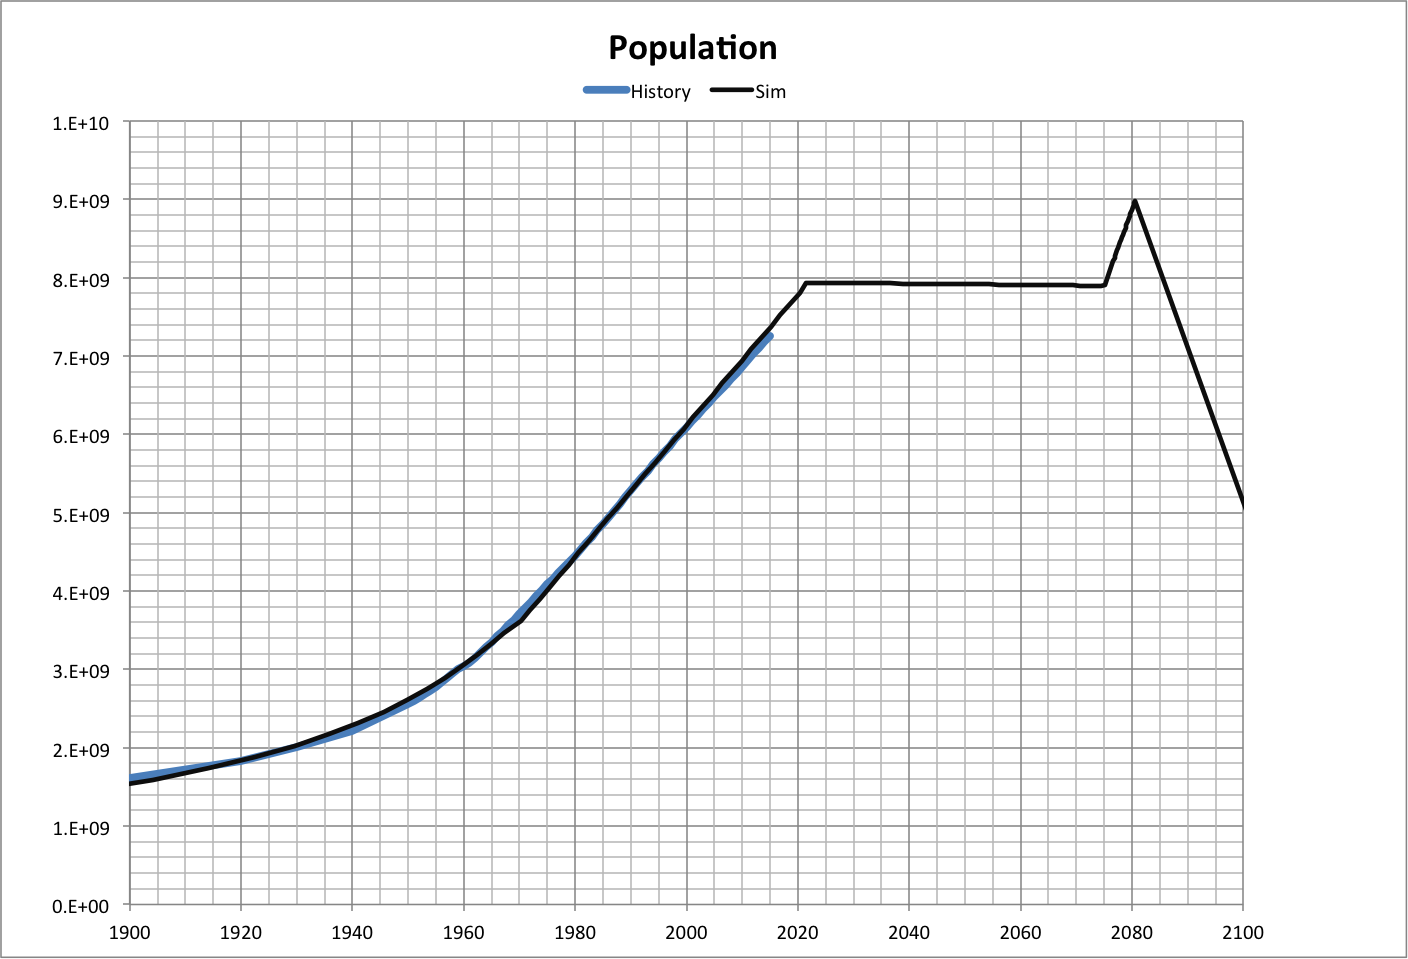
The validity of this estimate can be seen in the following graph of population. Roll over the image for a view of all population values.
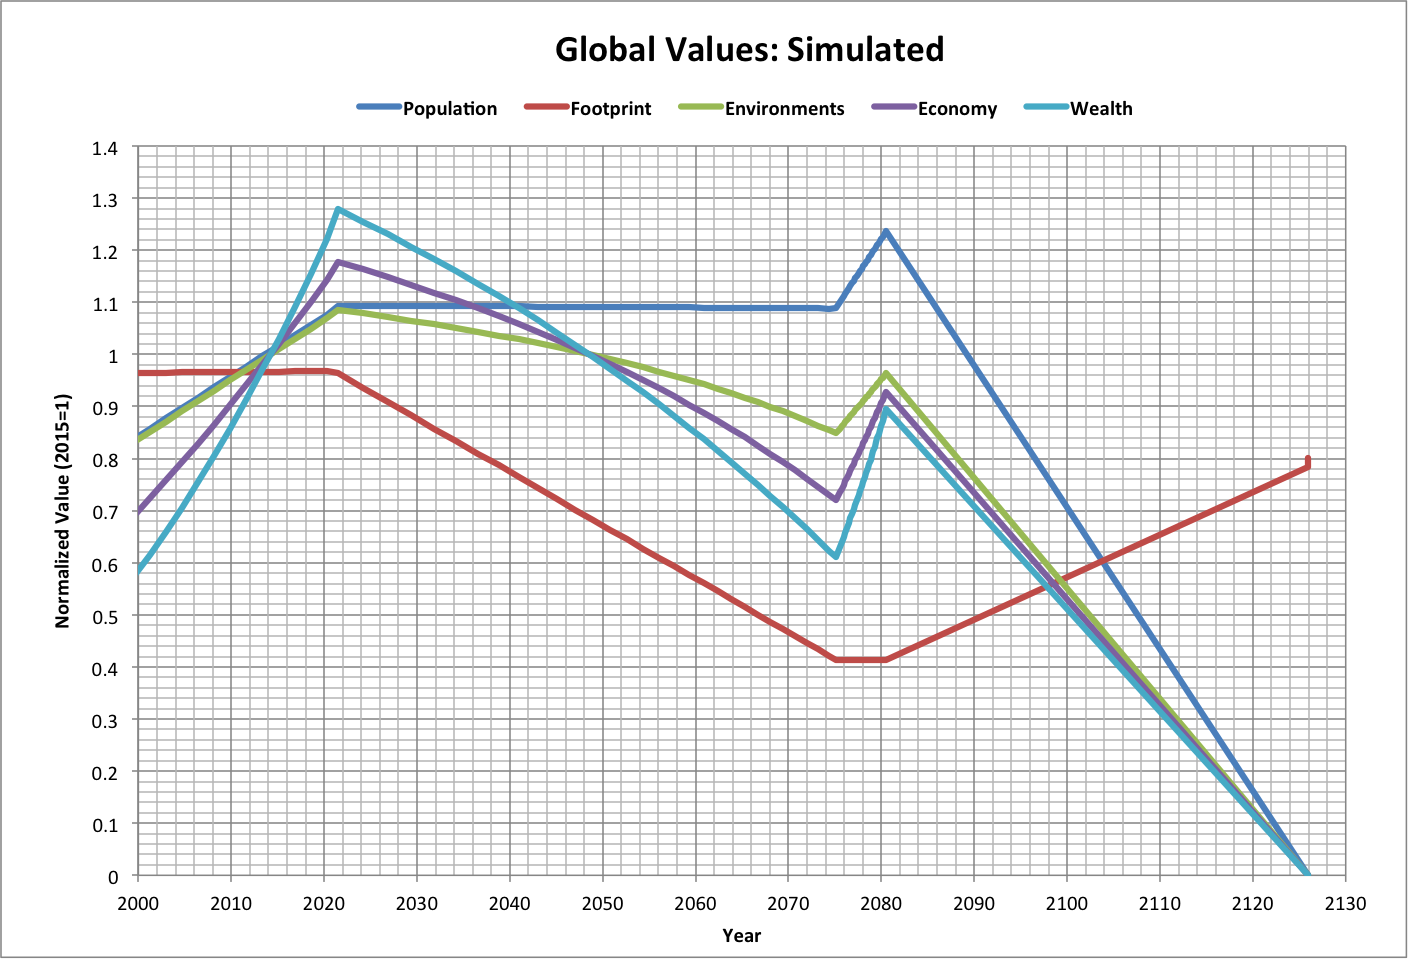
Normalizing global variables, the future is projected as follows (again, with no global warming). Roll over the image to also see historical values.
See also: