Combined Worst Climate
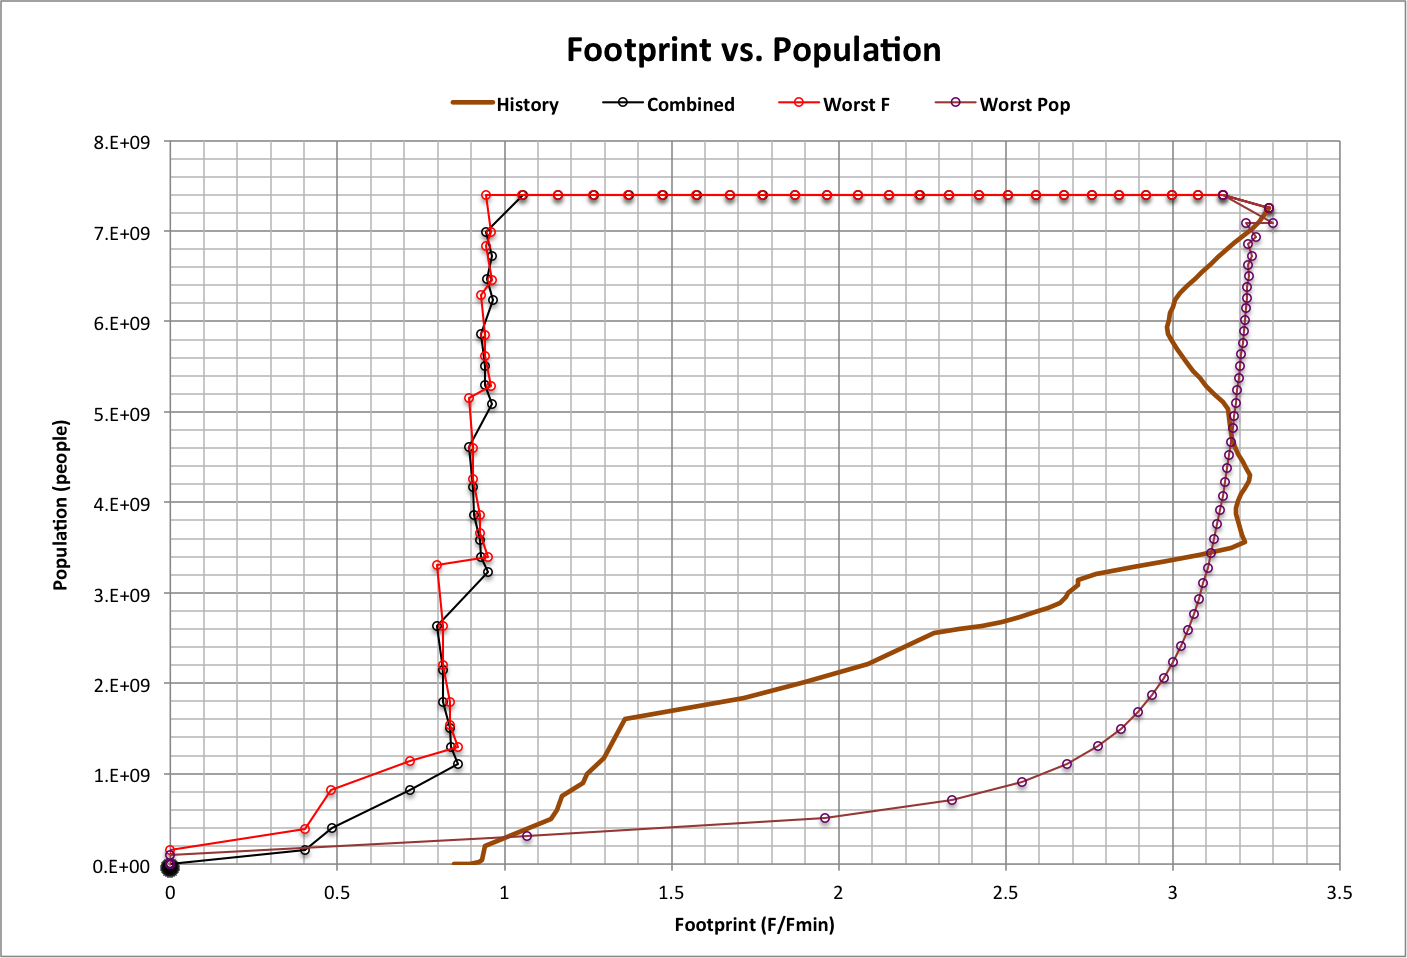
Based on considerable evidence that the worst case climate scenario is now in effect, two options with worst climate are combined here:
- Fixed population and varying footprint (Worst F)
- Fixed footprint and varying population (Worst Pop)
They are combined in proportion to their associated weights in the backcast simulations:
- Weight(Worst F) = a1 + a3 = 9.99281683E-01
- Weight(Worst Pop) = a2 + a4 = 7.18317E-04
The two options and the result of combining them are graphed below along with historical data from 10000 B.C. to 2015 A.D. Data points (circled) are separated by one year.
Roll over the image to see just the result and history.
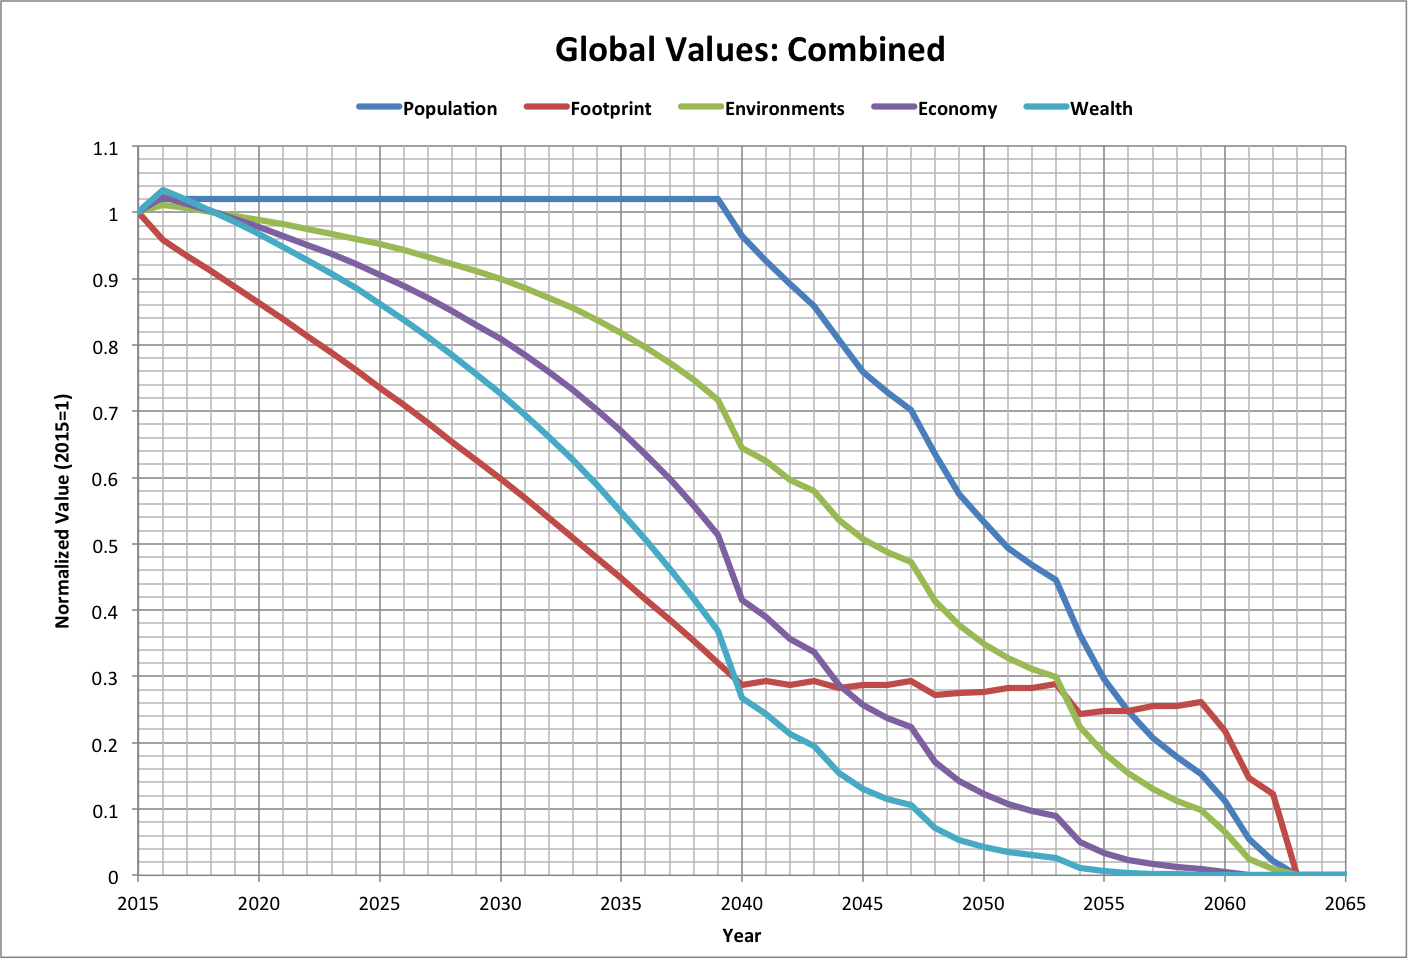
The following shows projected values of global variables, normalized to their values in 2015. Years are marked at mid-year.
Roll over the image for a close-up.
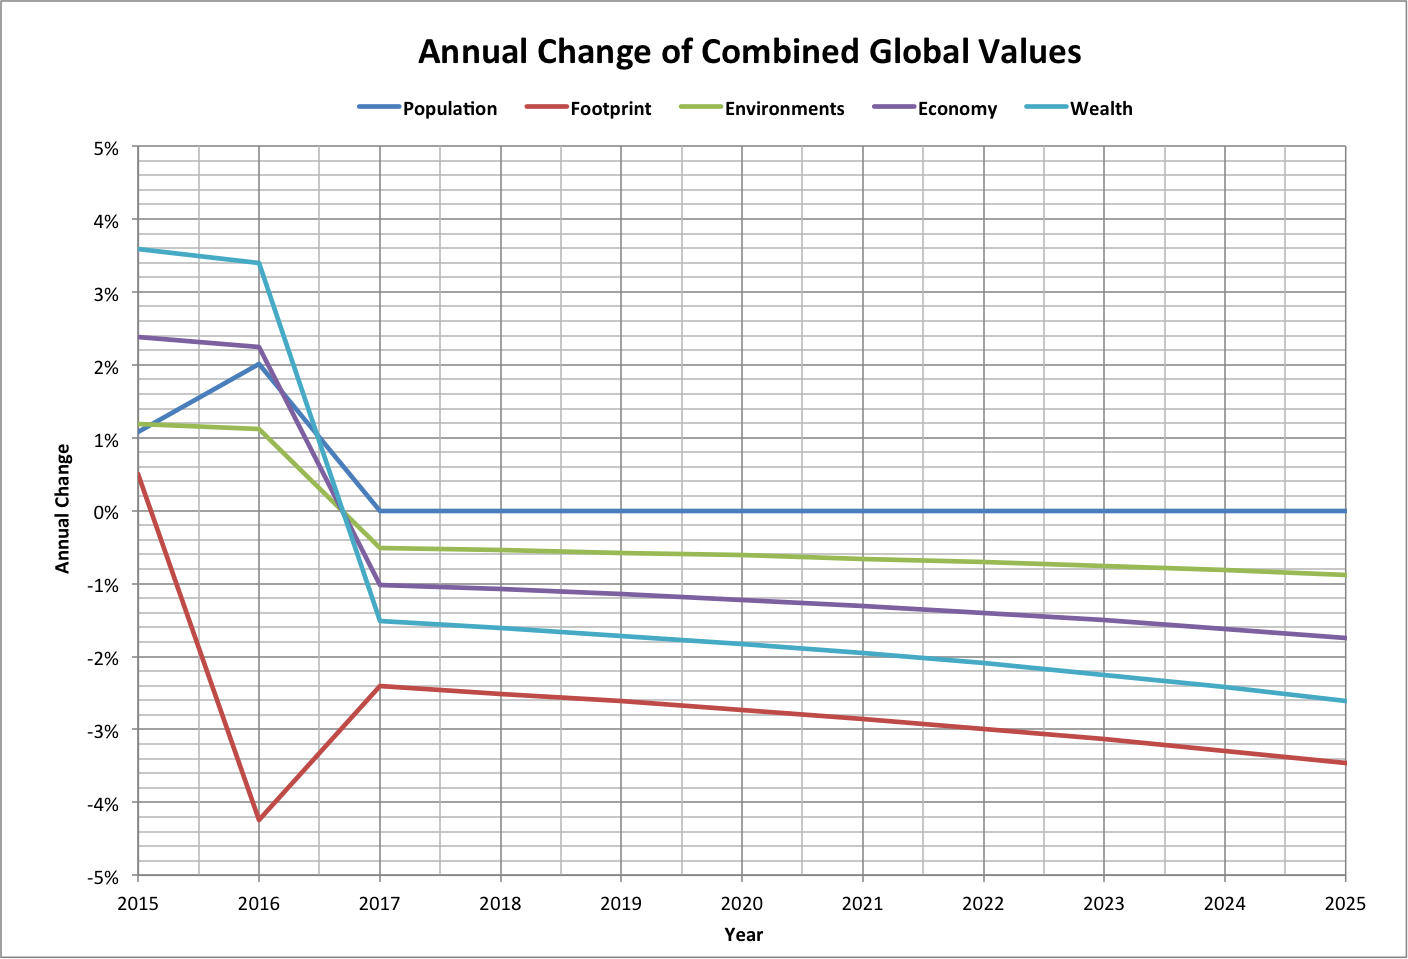
The following shows the projected annual change in percent for the decade after 2015. Roll over the image to see all years.
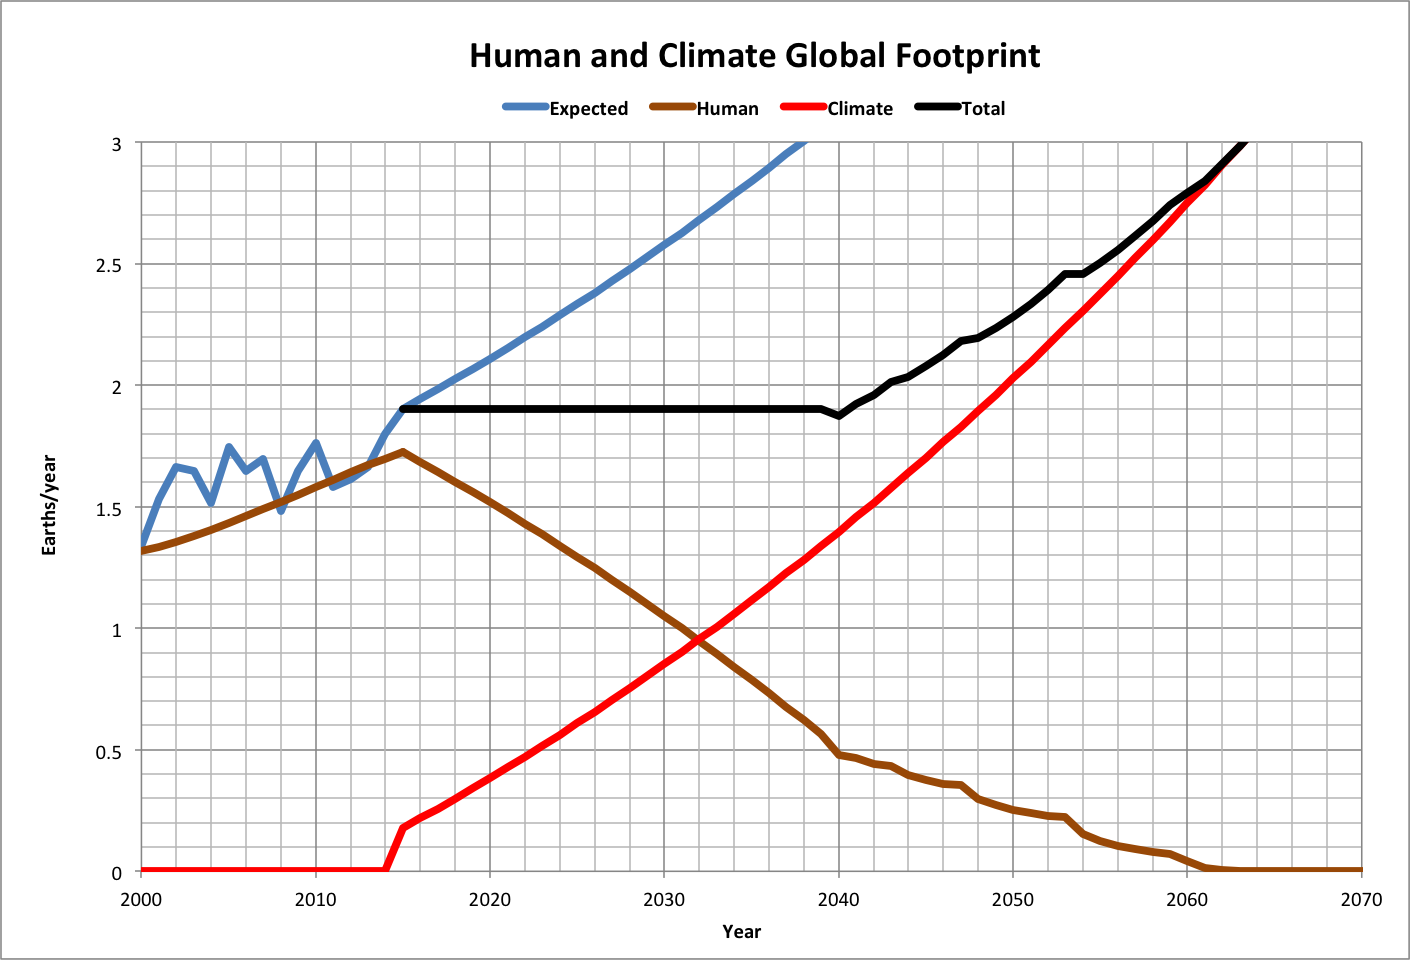
The following graph shows the components of global footprint, illustrating the key assumptions of climate impact and humanity's seeking of ecological limits.
- Expected is the translation of average global temperature into a global footprint, including its extrapolation from the historical trend for worst case climate
- Human is humanity's global footprint (Pop * F), including its response to limits
- Climate is the global footprint of sustained non-human emissions [Expected(year > 2015) - Human(year = 2015)]
- Total is the sum of Human and Climate