Safe Limits
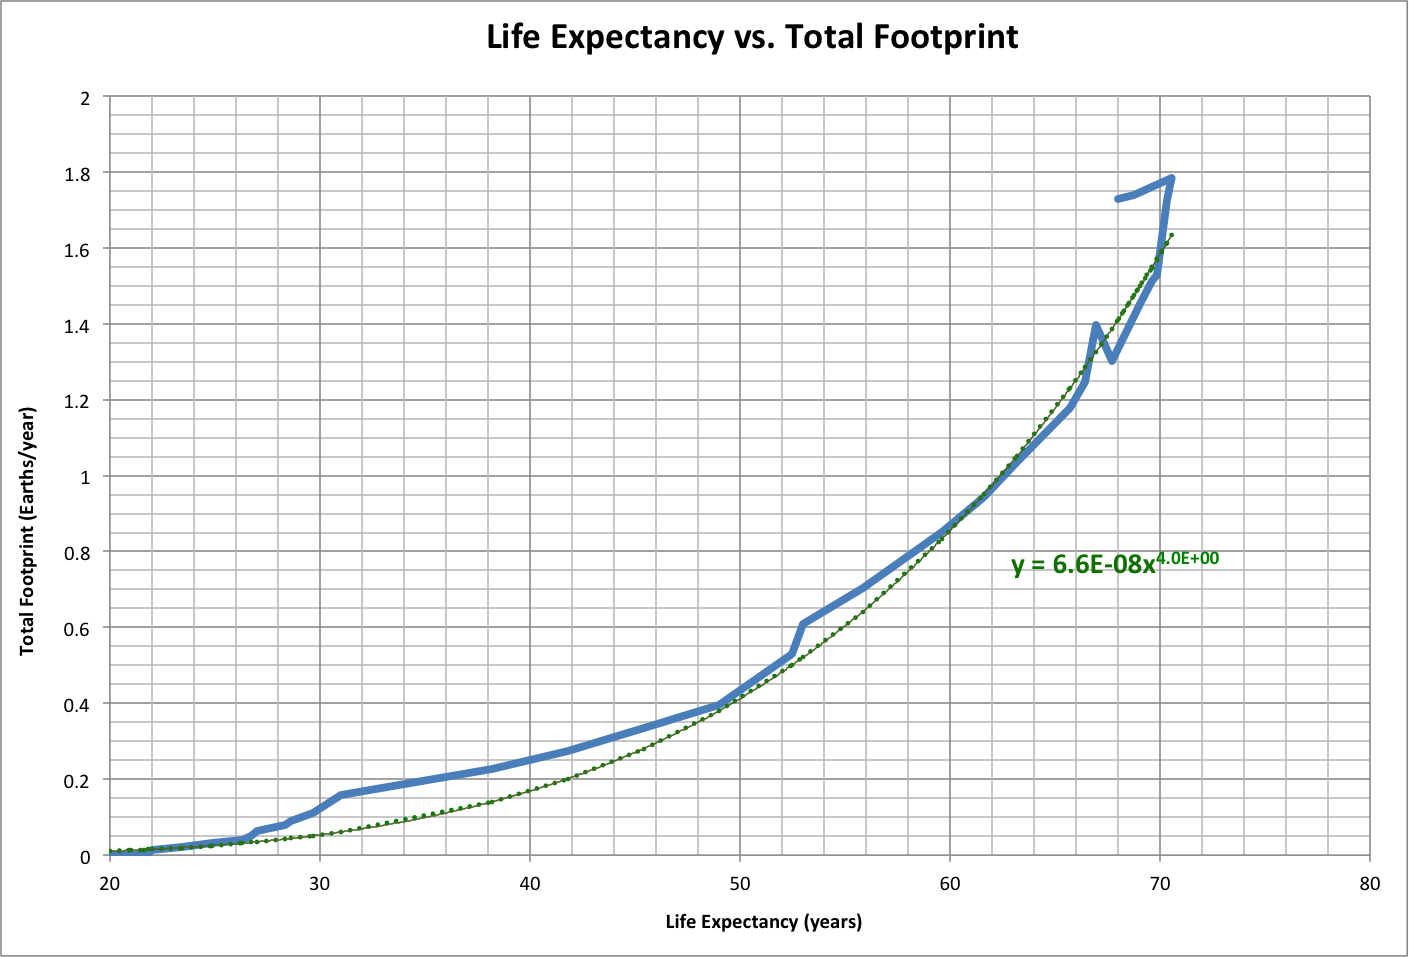
Using historical data and projections from the Population-Consumption model, total (ecological) footprint and logarithm of happiness (to the base hmax = 0.82) are closely correlated with life expectancy, as shown below. Roll over the image to see the other graph.
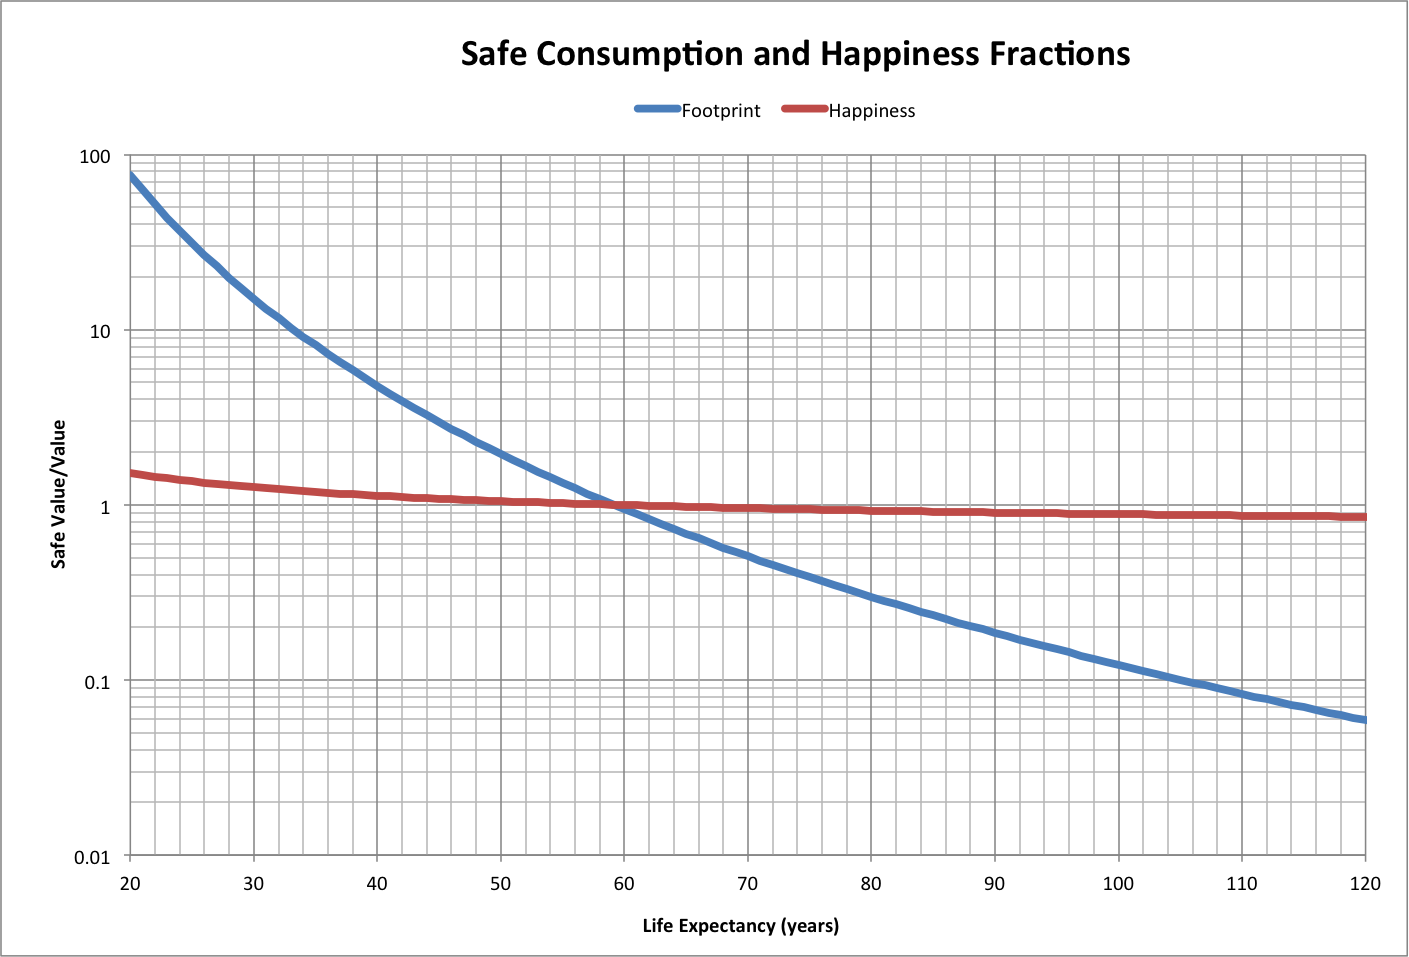
For a "safe value" of total footprint (Fe = 0.82 Earth/year), happiness h is 0.63 and life expectancy L is 59 years.
Note that, from 2010-2013 (the last historical points), Fe was more than twice the safe value and did not increase appreciably with life expectancy and then decreased along with life expectancy for the first time in history. This suggests that the world population may not be able to exceed an average life expectancy of 71 and a total footprint of 1.8.
With total footprint Fe = 6.6E-8 * L4 and log0.82(h) = 26.5 * L-.6, the following graph shows the ratios of safe values to values of total footprint and happiness for a range of life expectancies. Roll over the image to see the reciprocal (value/safe value).