Interacting Groups
Based on Happiness, Longevity, and Population
In the blog post "Group Interaction" I discussed how two groups might choose to interact, and what the consequences might be in terms of forming larger groups. I recently performed another set of simulations based on the modeling of population, longevity, and happiness discussed in "Assessments." This new set was for two subgroups, and for global historical data treated as interactions between 3000 subgroups.
There are three types of groups based on their interactions with each other:
- Isolated subgroups (no interactions)
- Combined (competition between subgroups)
- All (subgroups share equally)
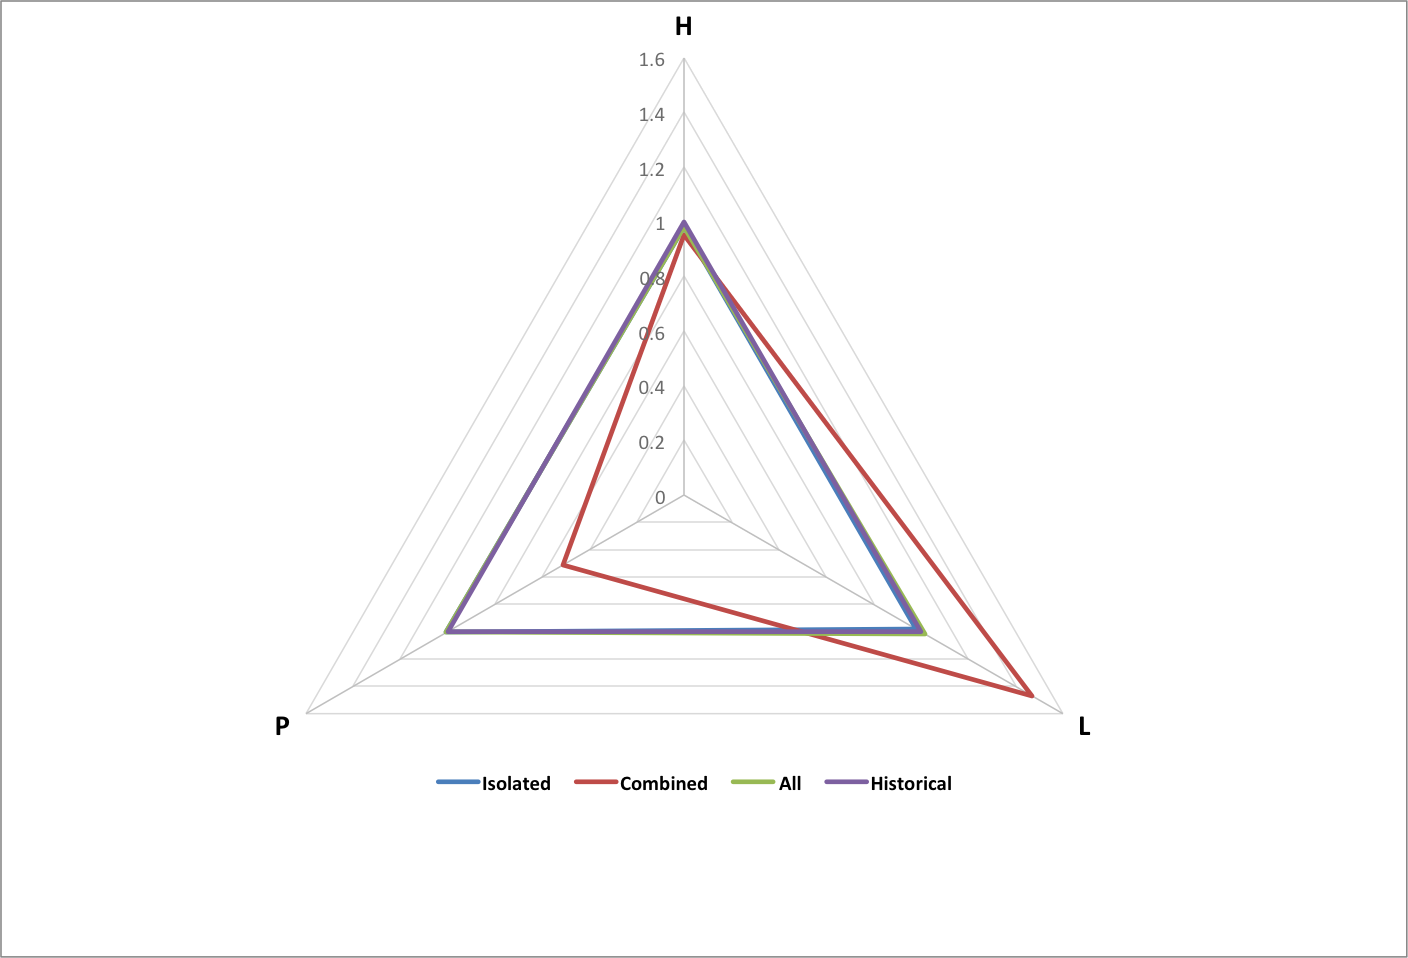
The following graph shows happiness (H), longevity (L), and population (P) for groups of each type, normalized to historical values. Each group consists of the same set of 3000 subgroups with random values within variable ranges chosen so that the All group matches historical data.
Variables and their ranges are as follows:
| Variable | Description | Minimum | Maximum |
| P | Population (people) | 0.00E+00 | 9.53E+04 |
| F/Fmin | Footprint | 8.50E-01 | 9.57E-01 |
| Crate | Growth Rate | 3.27E-04 | 4.15E-04 |
| FeTotal | Total Resources (Earth/year) | 9.28E-04 | 9.28E-04 |
See Happiness, Longevity, and Population for variable definitions.
For the Combined group, each subgroup's footprint in the group is proportional to its original footprint times its power, where power is the square of its happy environments (happiness times population), which is proportional to its economic activity. If the footprint is less than the historical minimum (0.85), the subgroup's population is adjusted so the footprint equals the minimum. The subgroup is allocated a fraction of total resources proportional to its new power (calculated with its new population and happiness).
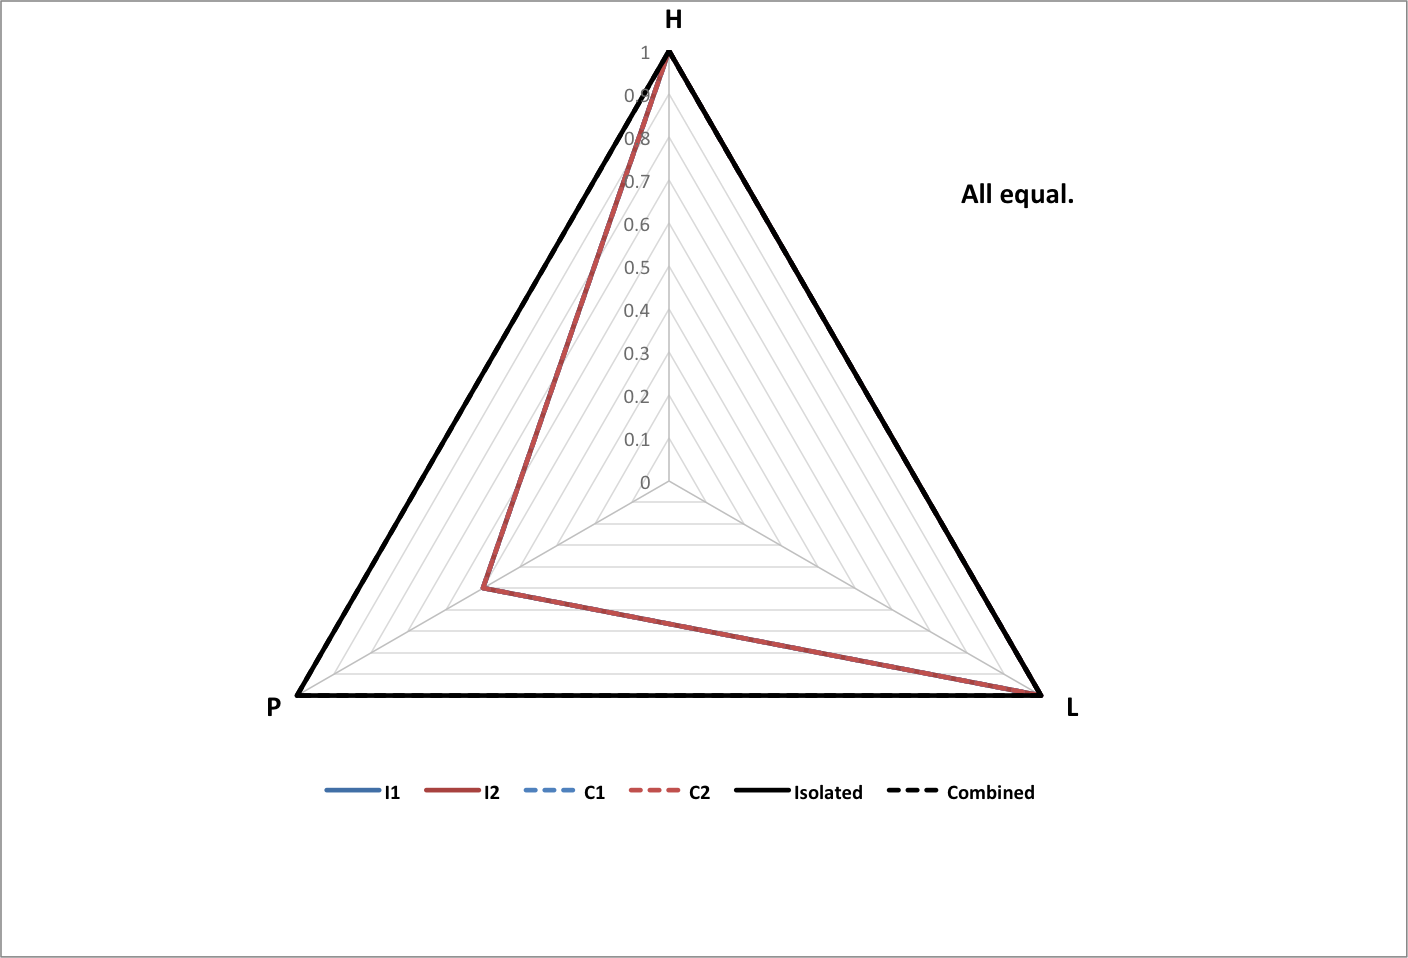
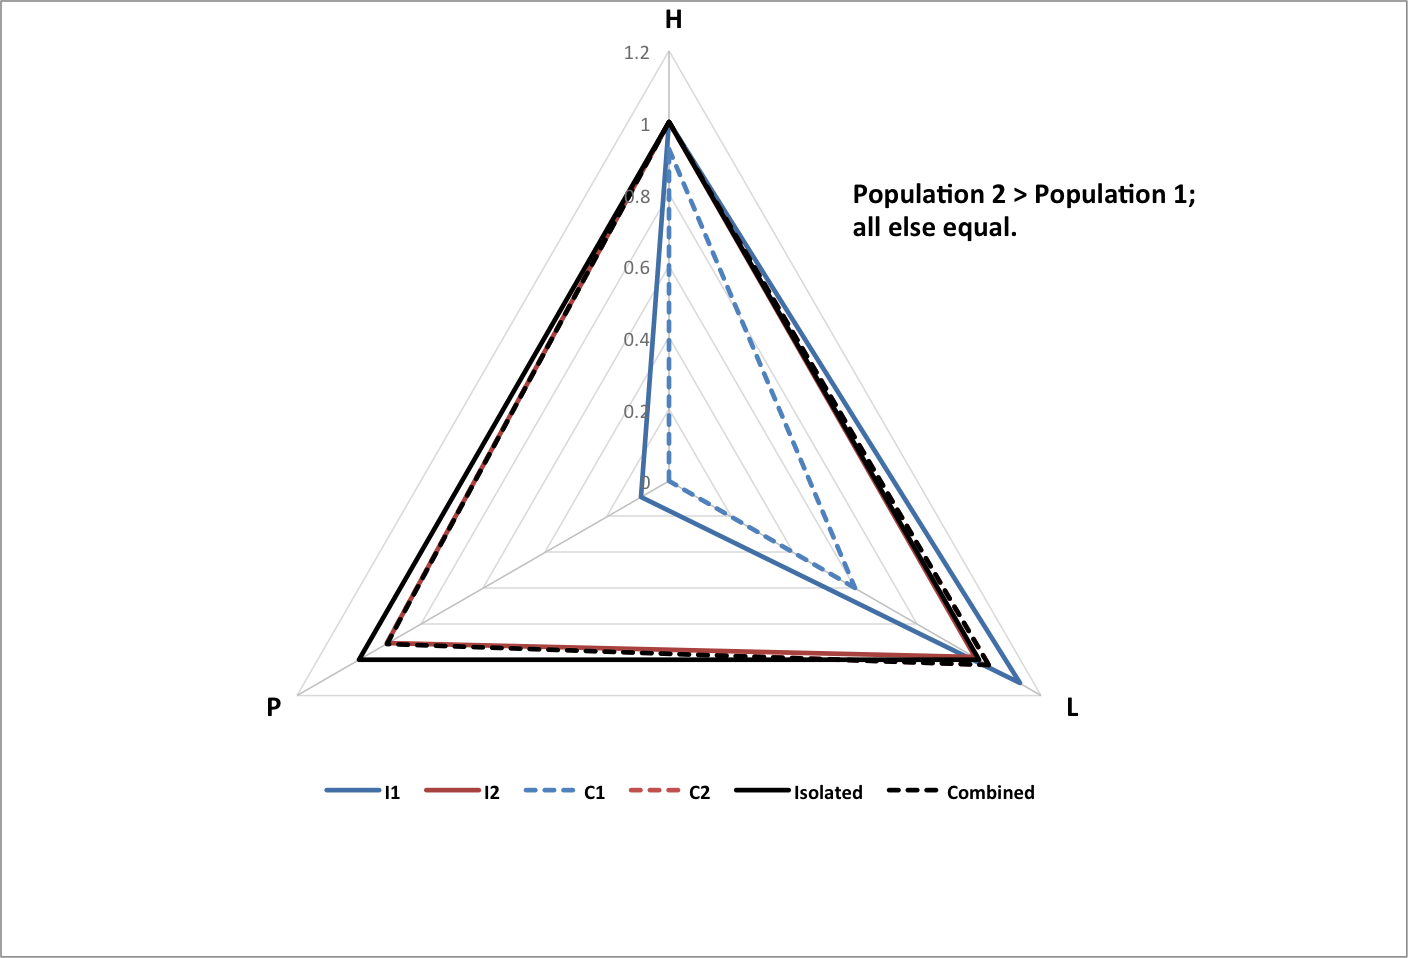
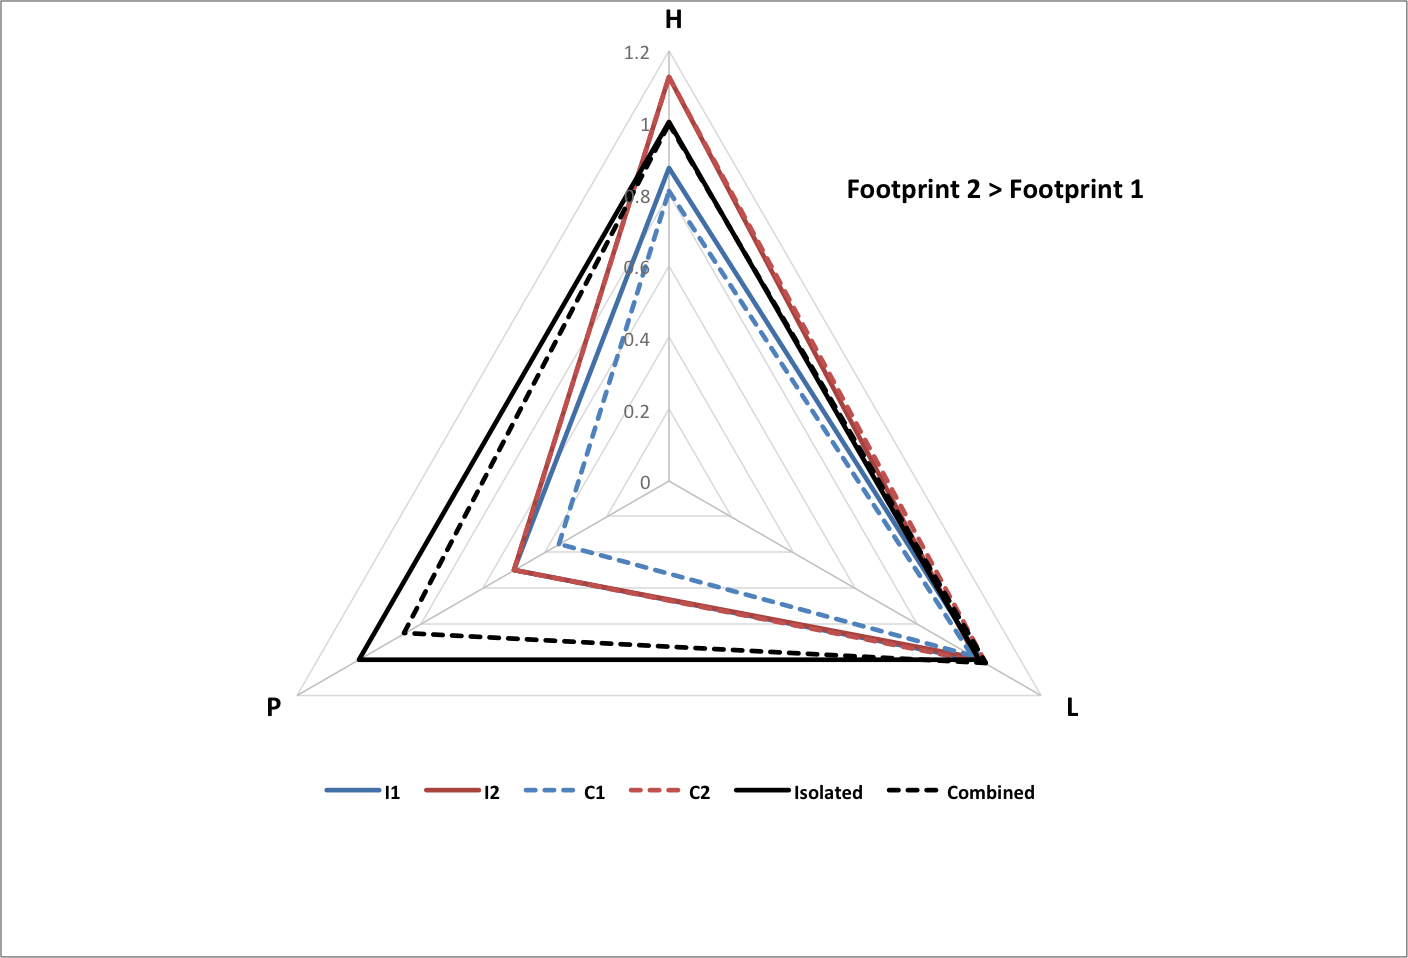
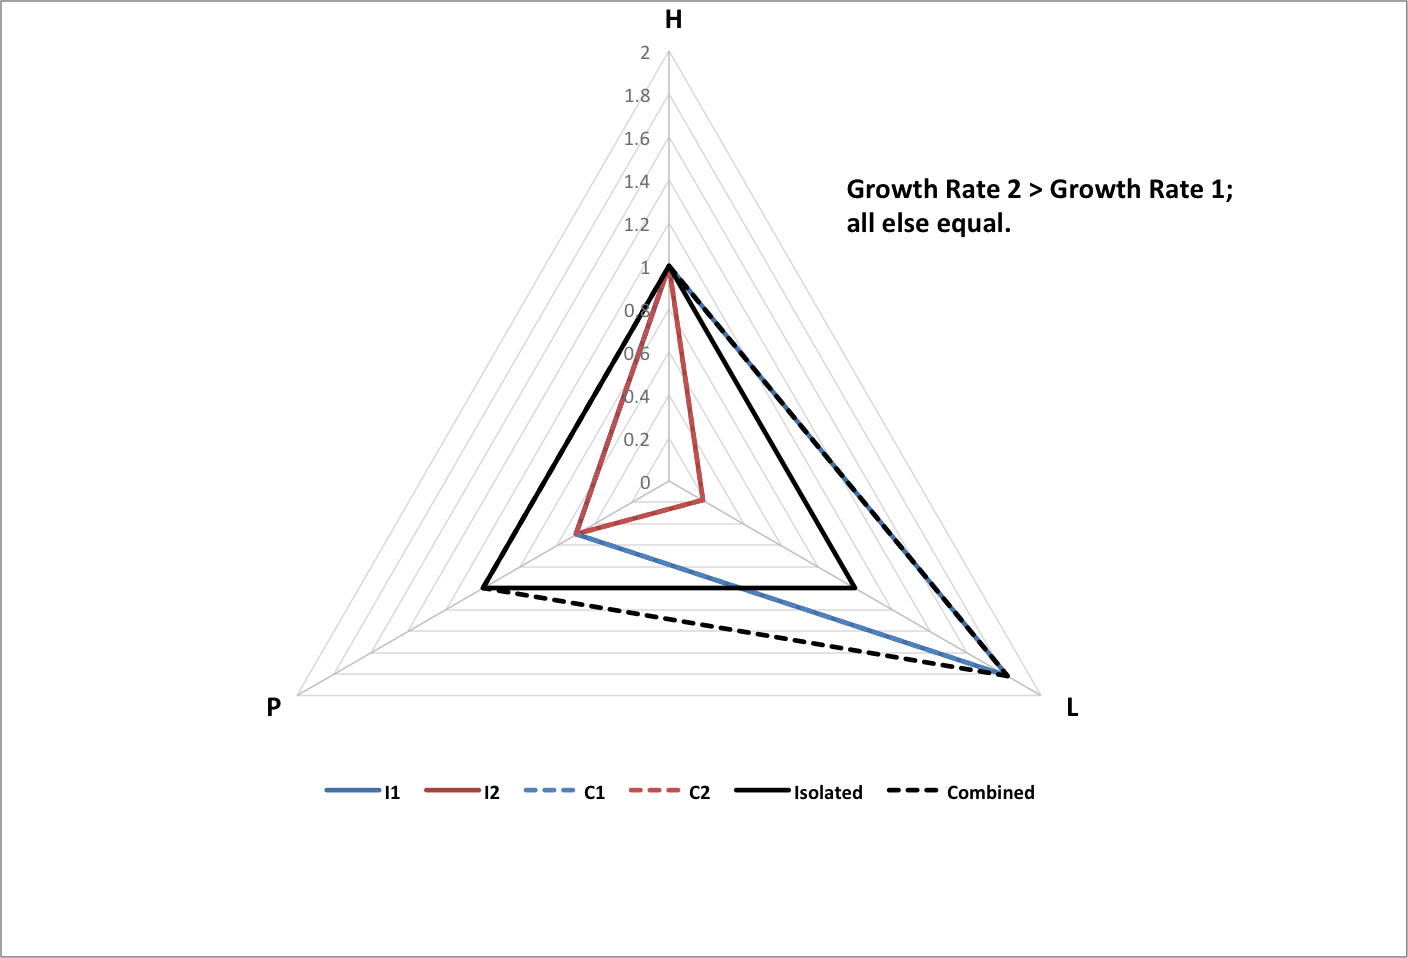
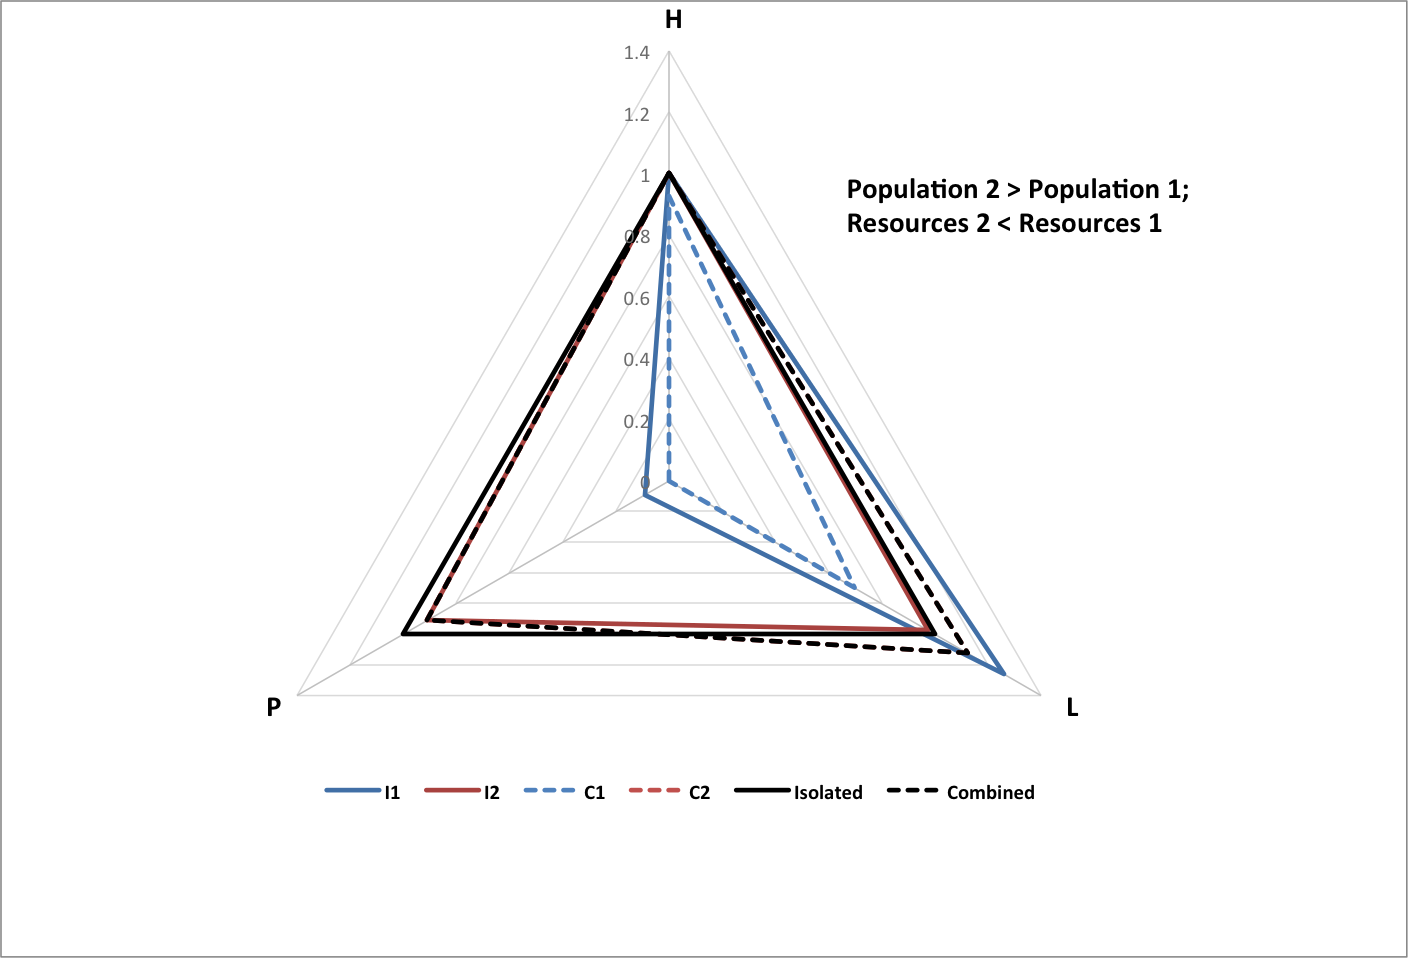
The following graphs show the results of two subgroups combining with each other, normalized to the total population of the original (isolated) subgroups, and the average happiness and longevity of the original subgroups.
- I1 is isolated subgroup 1
- I2 is isolated subgroup 2
- C1 is subgroup 1 as part of the combined group
- C2 is subgroup 2 as part of the combined group
- Isolated is the isolated groups as a whole
- Combined is the combined group as a whole
Roll over each image for a text summary of the results.
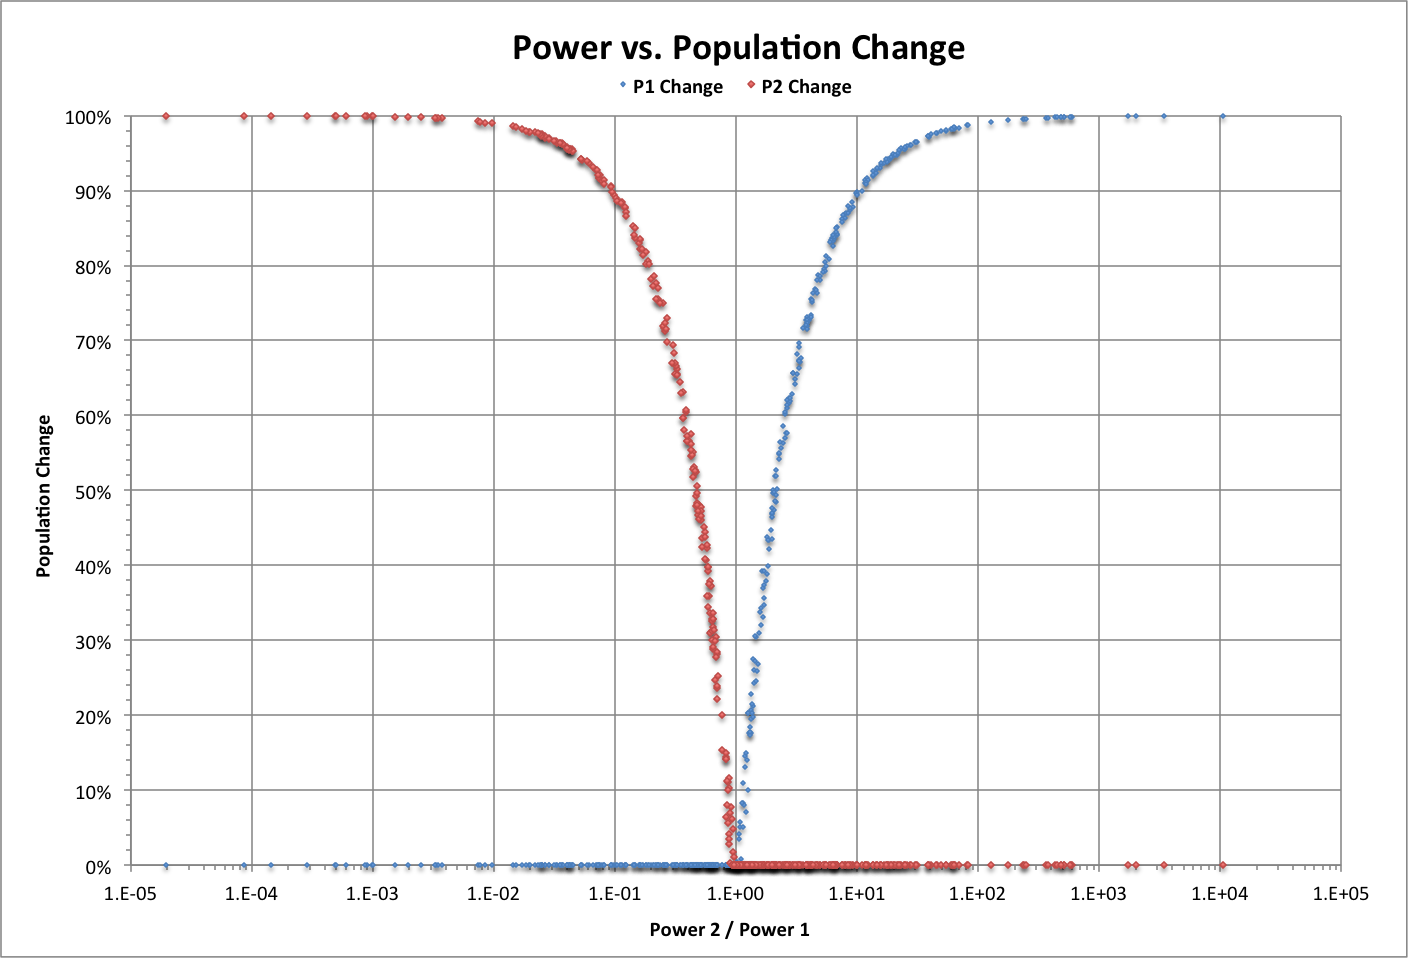
The following graph shows how the relative powers (Power 1 and Power 2) of two isolated groups influences how much population they will lose (P1 Change and P2 Change as fractions of the original populations) when they become subgroups in a combined group. Values of initial parameters are chosen to match world history for just two interacting groups.
Note that no population change occurs for about 3% of this random sample of 500 pairs; these correspond to differences in growth rate only.