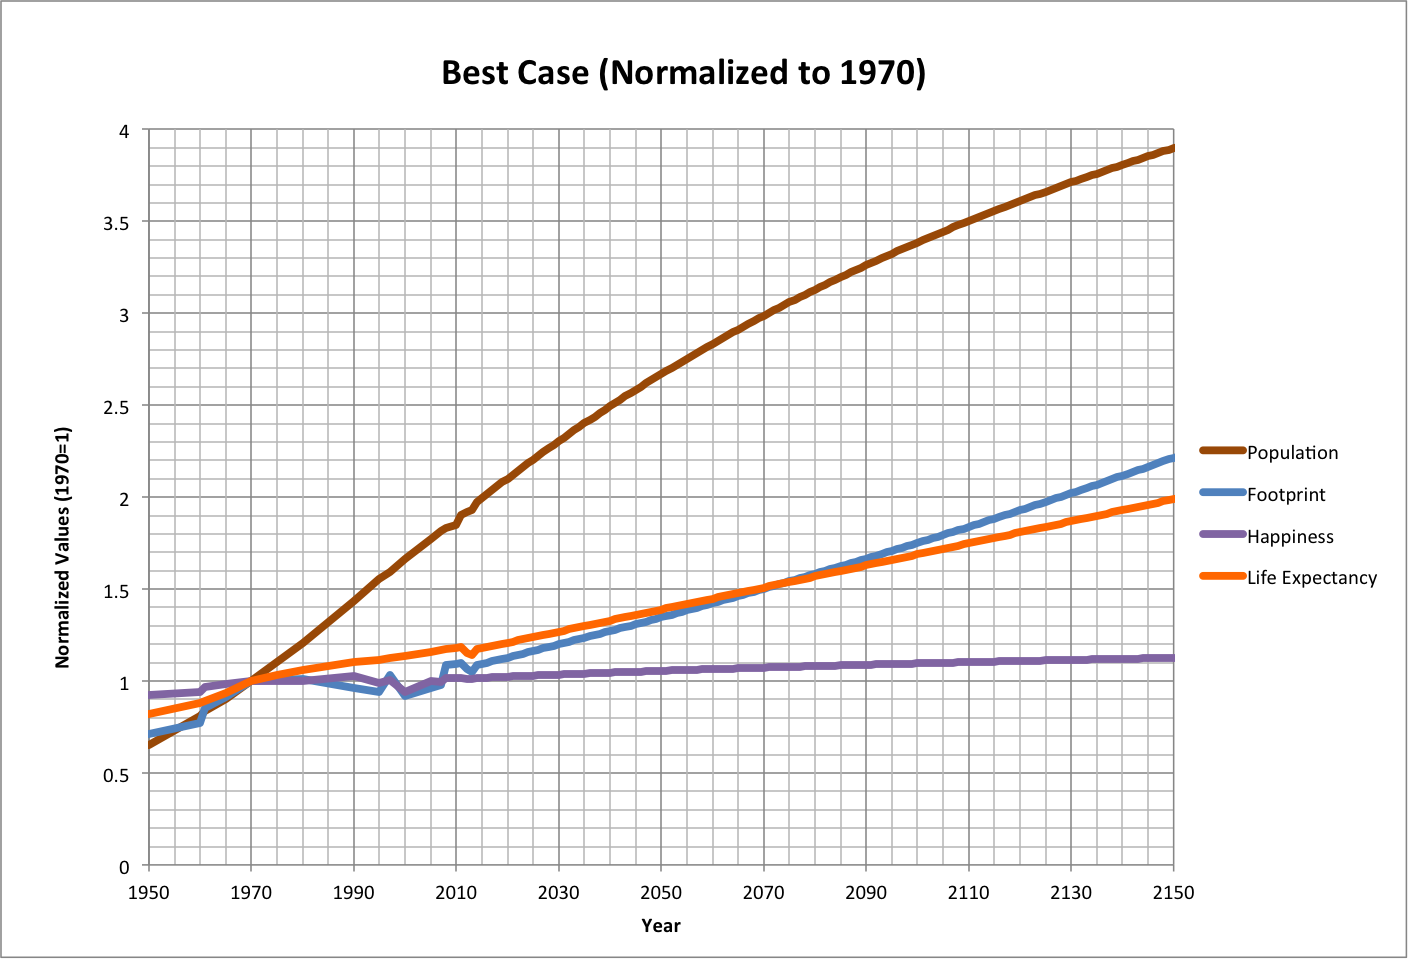
In the Best case scenario, all variables grow until the maximum happiness limit is reached. The following graph illustrates the near-term trajectories of these variables, normalized to their values in 1970 (about the time that the total ecological footprint last enabled other species to fully provide renewable ecological resources and have enough left for their own survival).
 |
As in the Worst case, total ecological footprint is expected to reduce the maximum environments, as suggested by scaling them to the Living Planet Index (a measure of the populations of other species).
Figure A illustrates the direct effect on LPI, which breaches the inhabited environments in 2008 and the human population directly in 2019. It reaches zero in 2052.
Figure B shows what would happen if the LPI grew along with inhabited environments (the two were "coupled"). If we had access to the resources needed to support growth, the rest of Nature would be effectively irrelevant.
Figure C illustrates the Best case's version of the favored scenario described in the Worst case discussion. Here, inhabited environments are driven with the LPI low enough for the Ppop/Epop ratio to approach hmax, after which they remain at that ratio while rising with life expectancy. As with the Worst and expected cases, the environments are offset from the population, accounting for the difference between hmax and actual happiness.
Figure A |
Figure B |
Figure C |
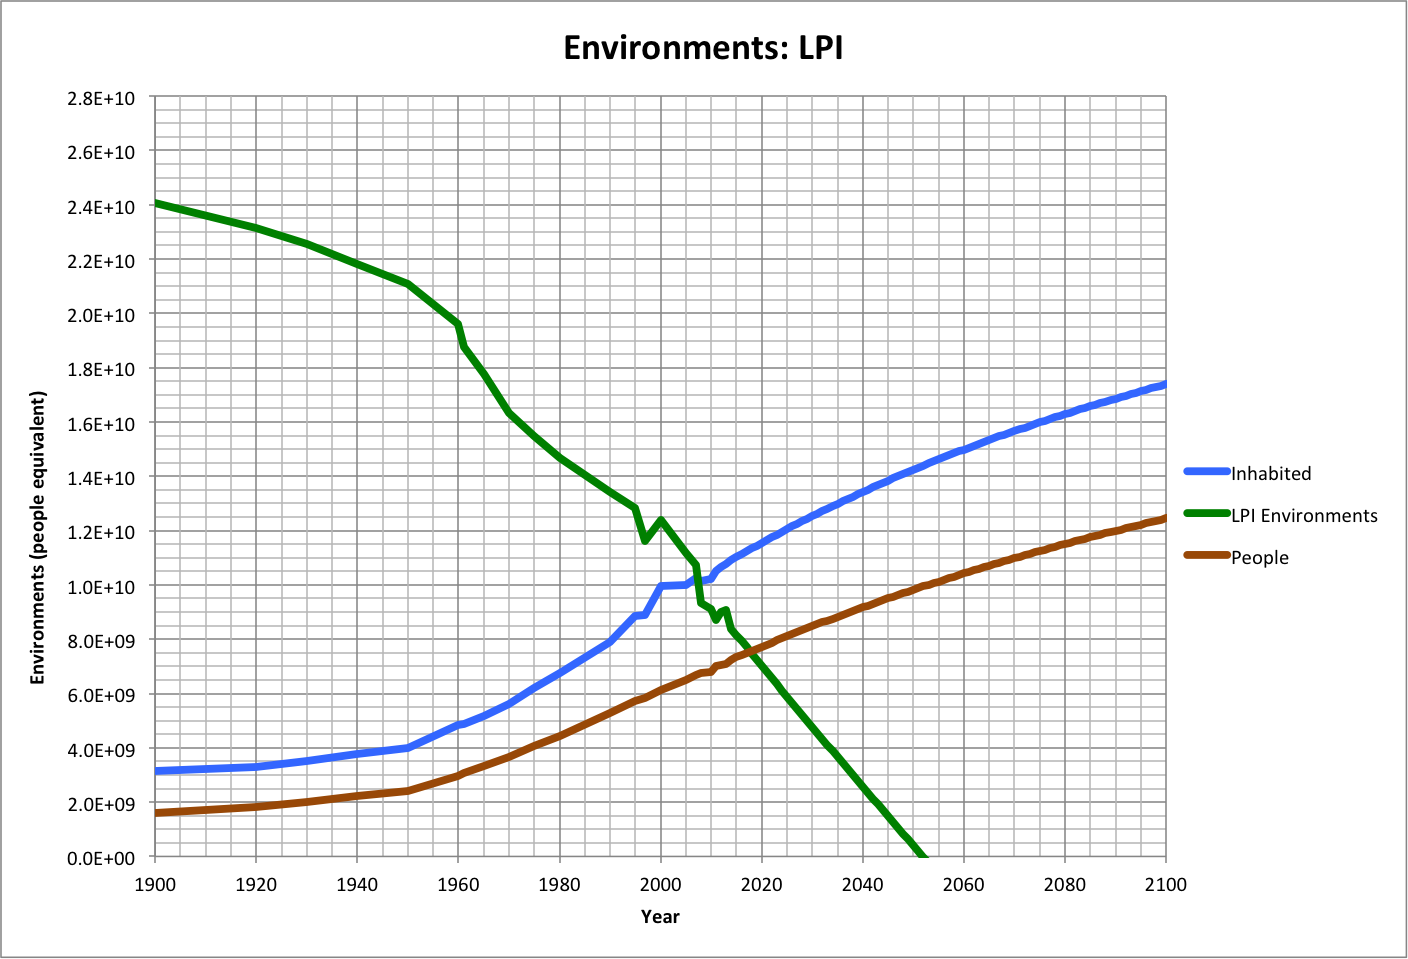
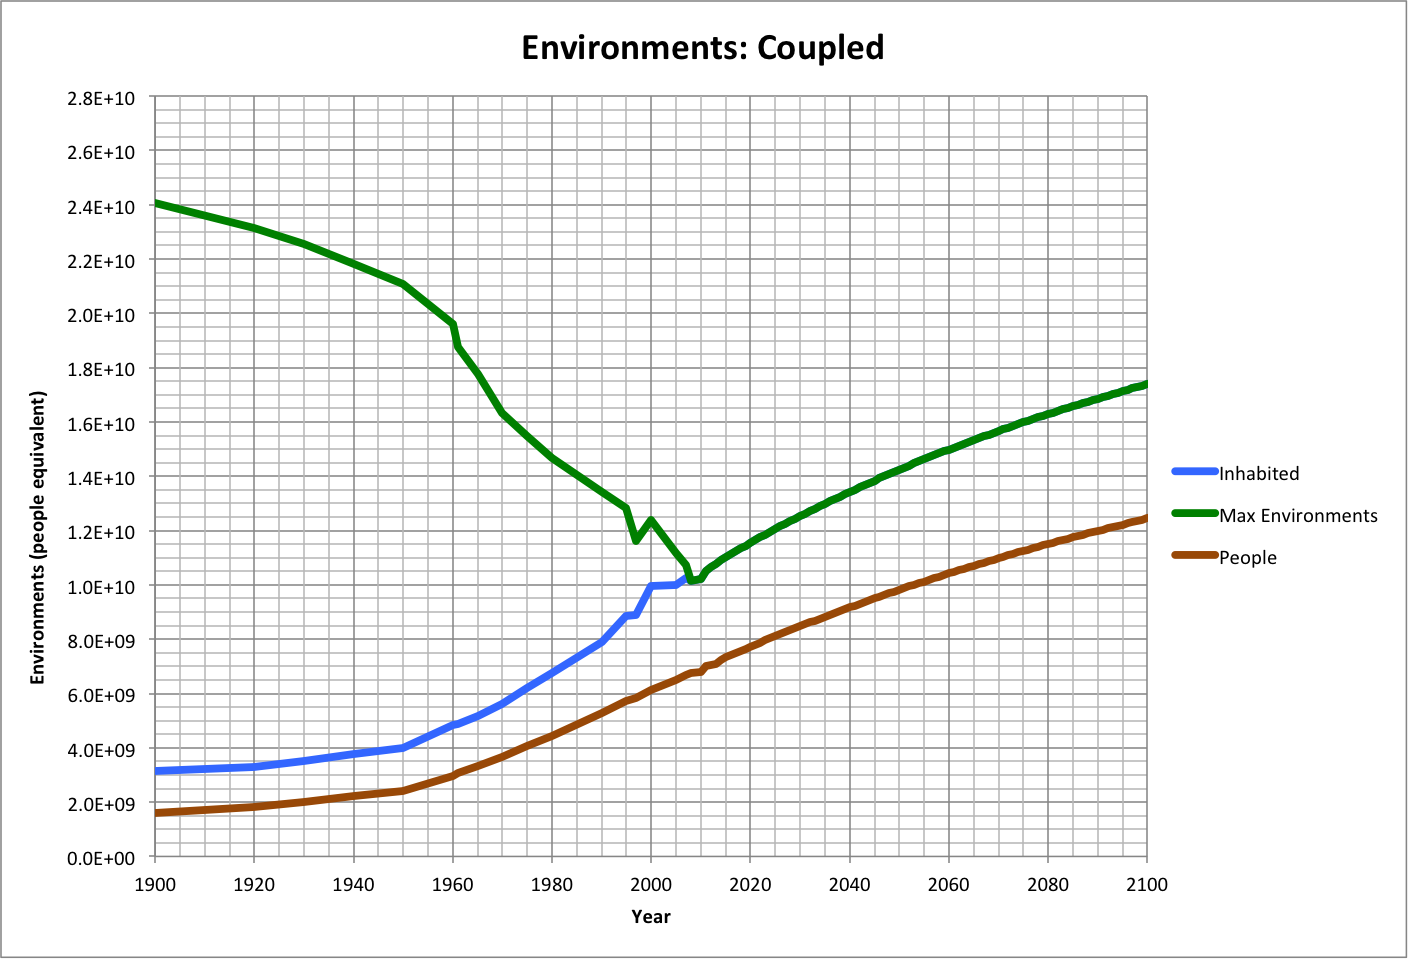
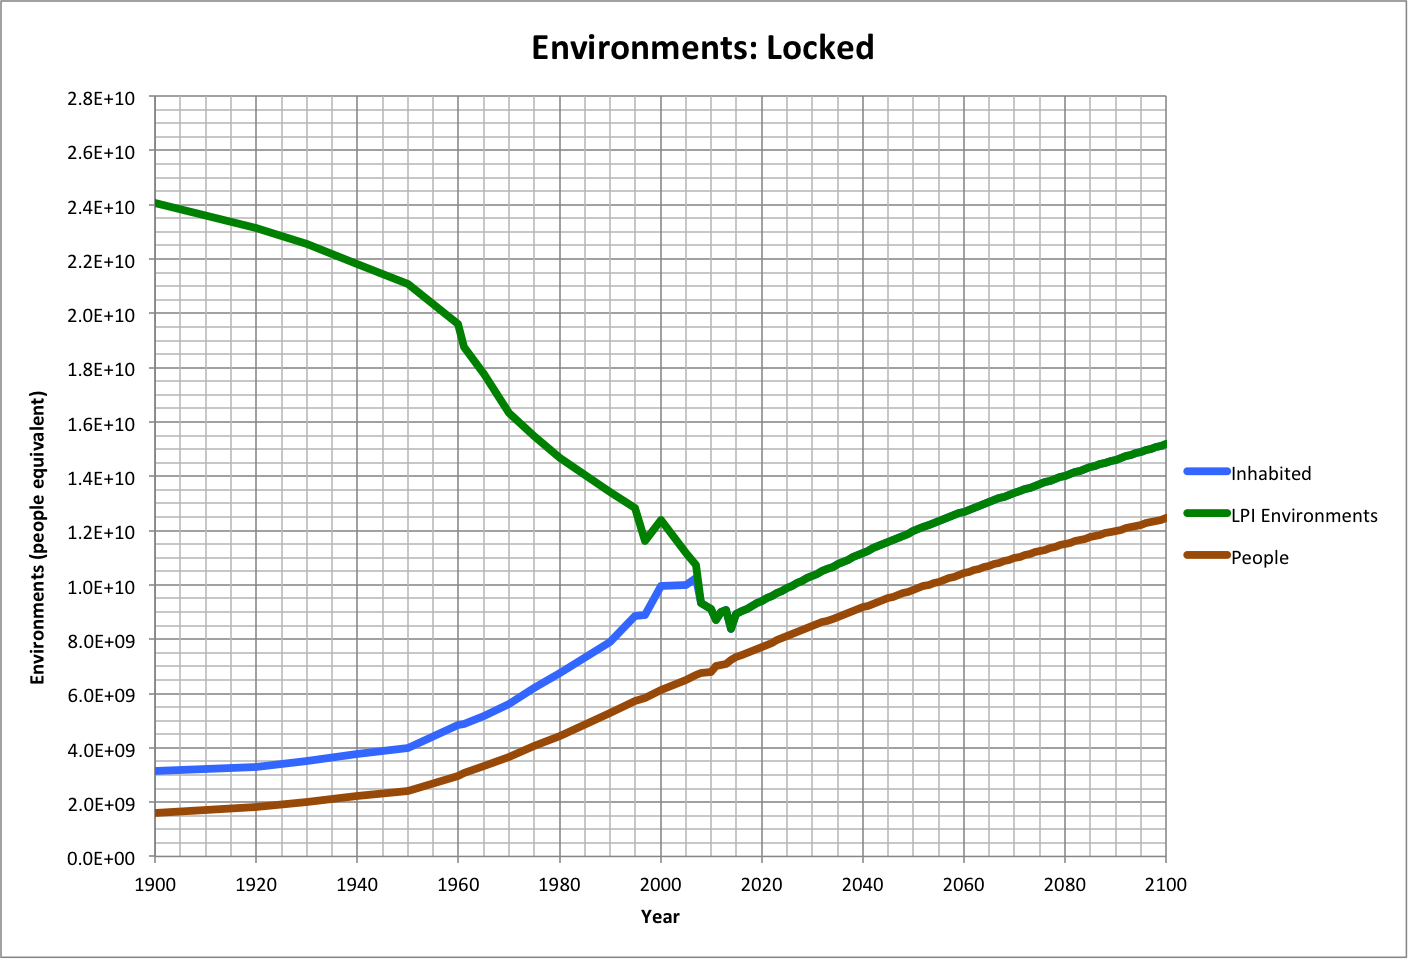
Figure D
Figure E
See also:
Population-Consumption v4 Main Page