Since 2009, there have been effectively no more environments for humanity to create, and the amount we have already created is declining; that is, we are not "locking" our inhabited environments to the preferred number (the ratio of population to happiness). This page shows statistical distributions for each year from 2010 to 2013 in animated form, and explores how wealth has varied over the entire population over that period. |
 |
| The animation above shows how the distributions of population, environments, happiness, wealth, and happy environments likely changed by year for the period 2010-2013. If they are plotted against the absolute value of Z, the following animation shows the amount of commonality for both sides of the graph. |
 |
| To identify the values of Z where wealth is highest, we can sum up all of the wealth over the period. As seen below, wealth favors one side of the graph, with the highest amount at 0.132 sigma. |
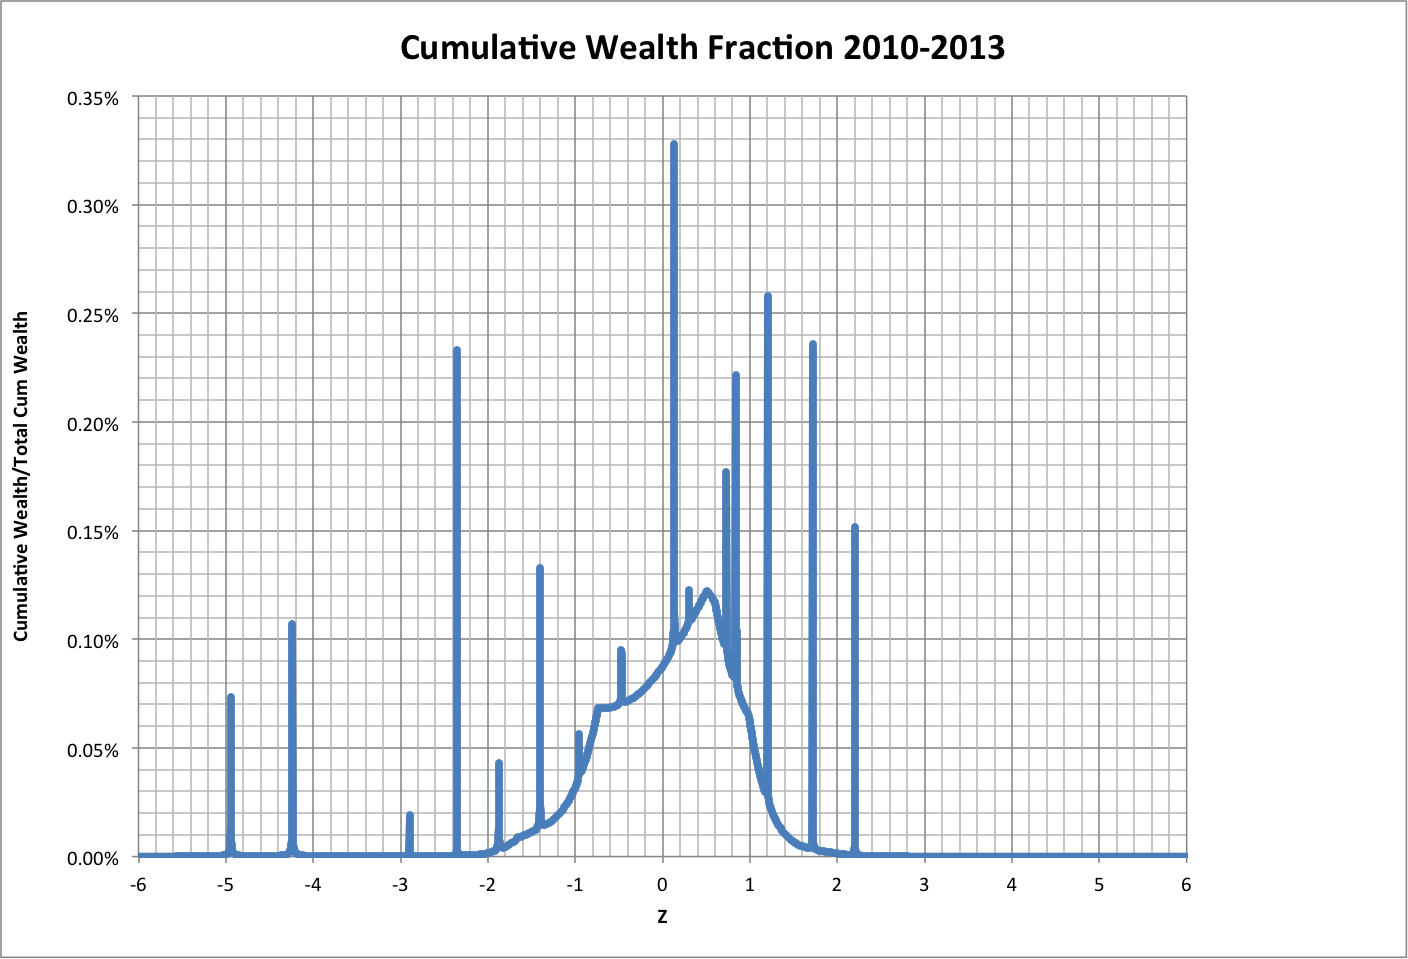 |
| The distribution of wealth (as described on the Economics page) changed as follows: |
 |
See also:
Happy Environments (blog post)