Groups (Timelines Version 5)
NOTE: Terms in italics are defined in Timelines Version 5.
Groups can interact with each other to form a new group in one of at least three ways: weighted, summed, or mixed. For two such groups with values V and Weight for a given variable, the results of these interctions are calculated as follows (where MAX is the maximum of two numbers).
| Weighted: | Vweight = ( Weight1 * V1 + Weight2 * V2 ) / ( Weight1 + Weight2 ) |
| Summed: | Vsum = V1 + V2 |
| Mixed: | Vmix = ( Weight1 * V1 + Weight2 * V2 ) / MAX( Weight1 , Weight2 ) |
In the Timelines model, the state of a group can be derived from combinations of three basic variables: Population, Consumption, and Capacity. Values of other global variables can be derived from combinations of these.
Changes in state of the world group over an interval of time is easily modeled as the interaction of the group (Group 1) at the beginning with another group (Group 2) to form a mixed group that becomes Group 1 for the next interval of time. The weights for Group 1 are all equal to 1, and the weights for Group 2 are all equal to per-capita consumption C for Group 2.
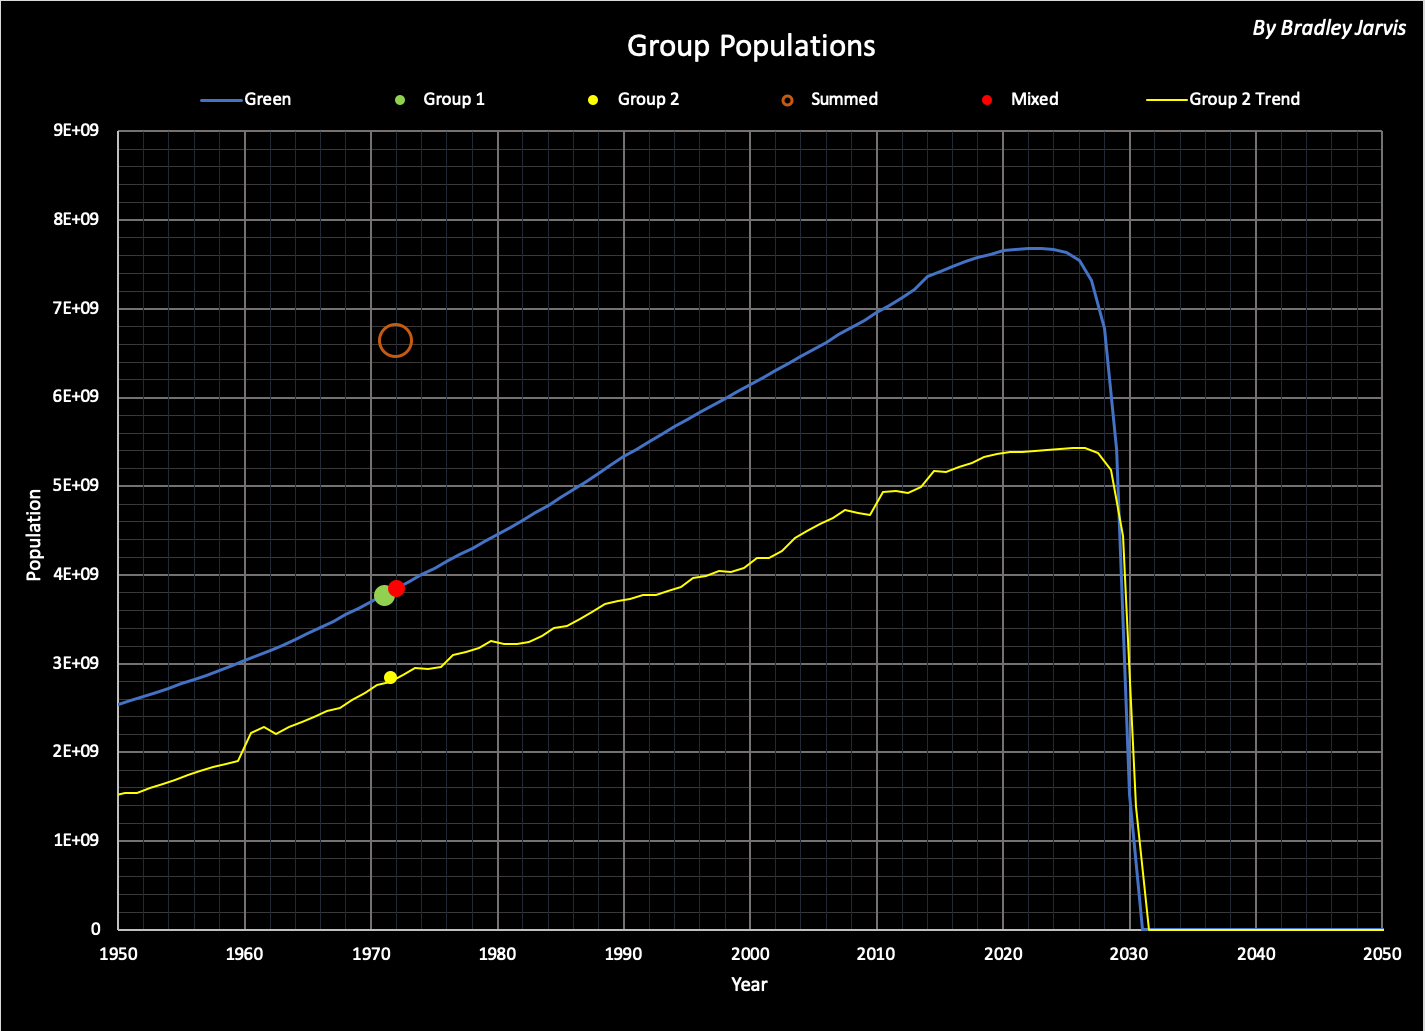
Values for Population are shown in the following graph for groups in the Green simulation. The circles illustrate the groups for the interaction from 1971 to 1972 (Group 1 is plotted for year 1971, Group 2 is plotted for 1971.5, and both Summed and Mixed group populations are plotted for 1972). The blue line shows the annual values of Group 1 populations, and the yellow line shows the values of Group 2 populations between each pair of years. Roll over the image for more years.
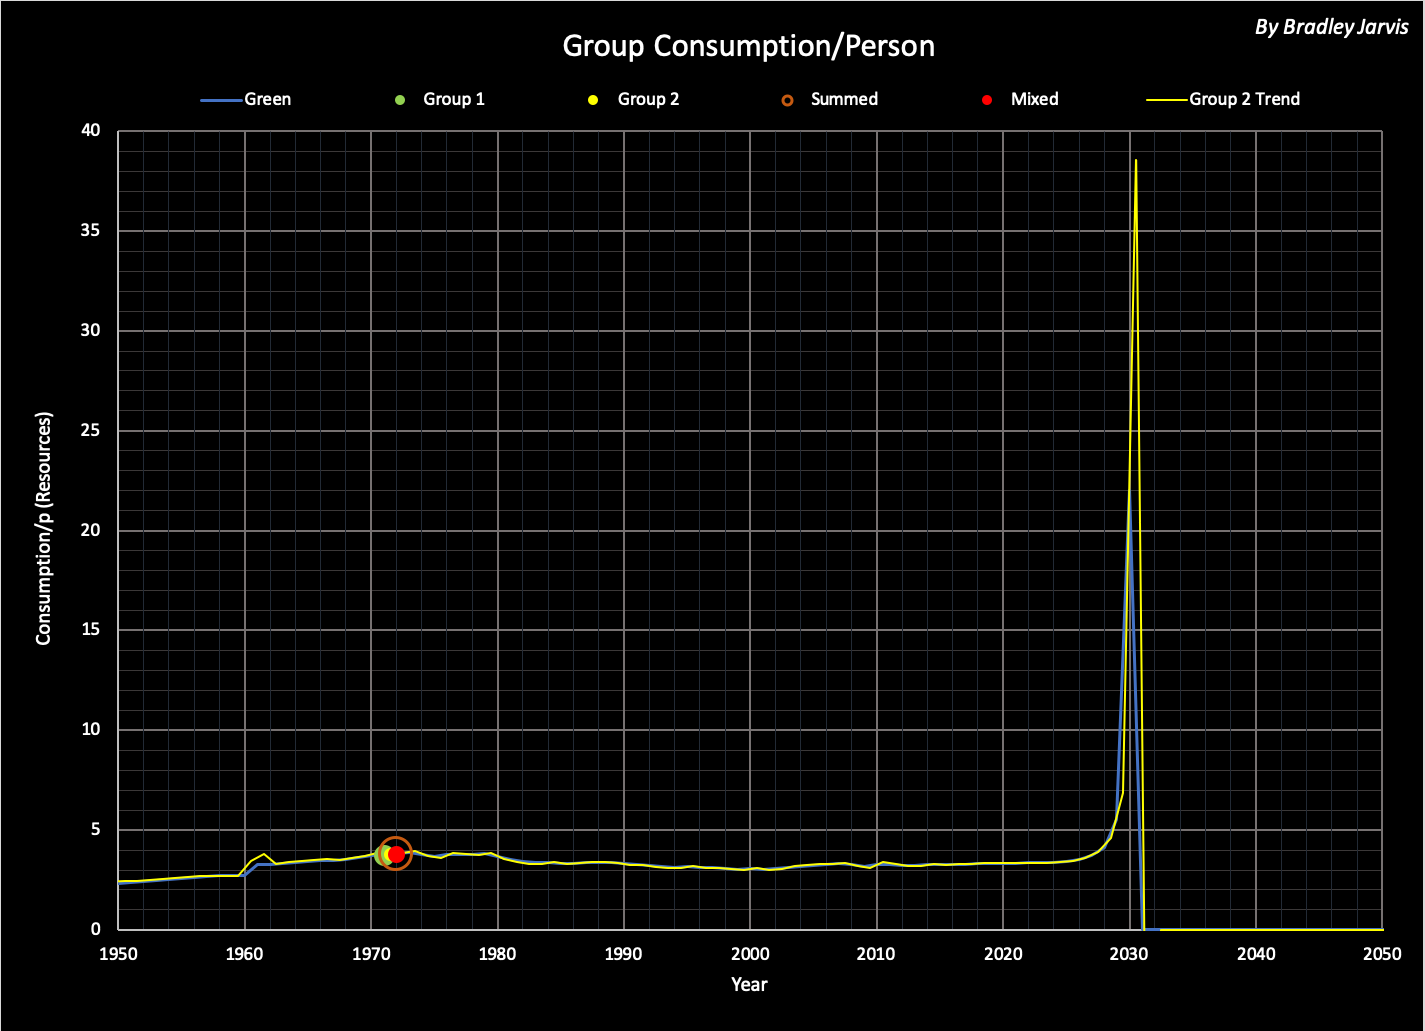
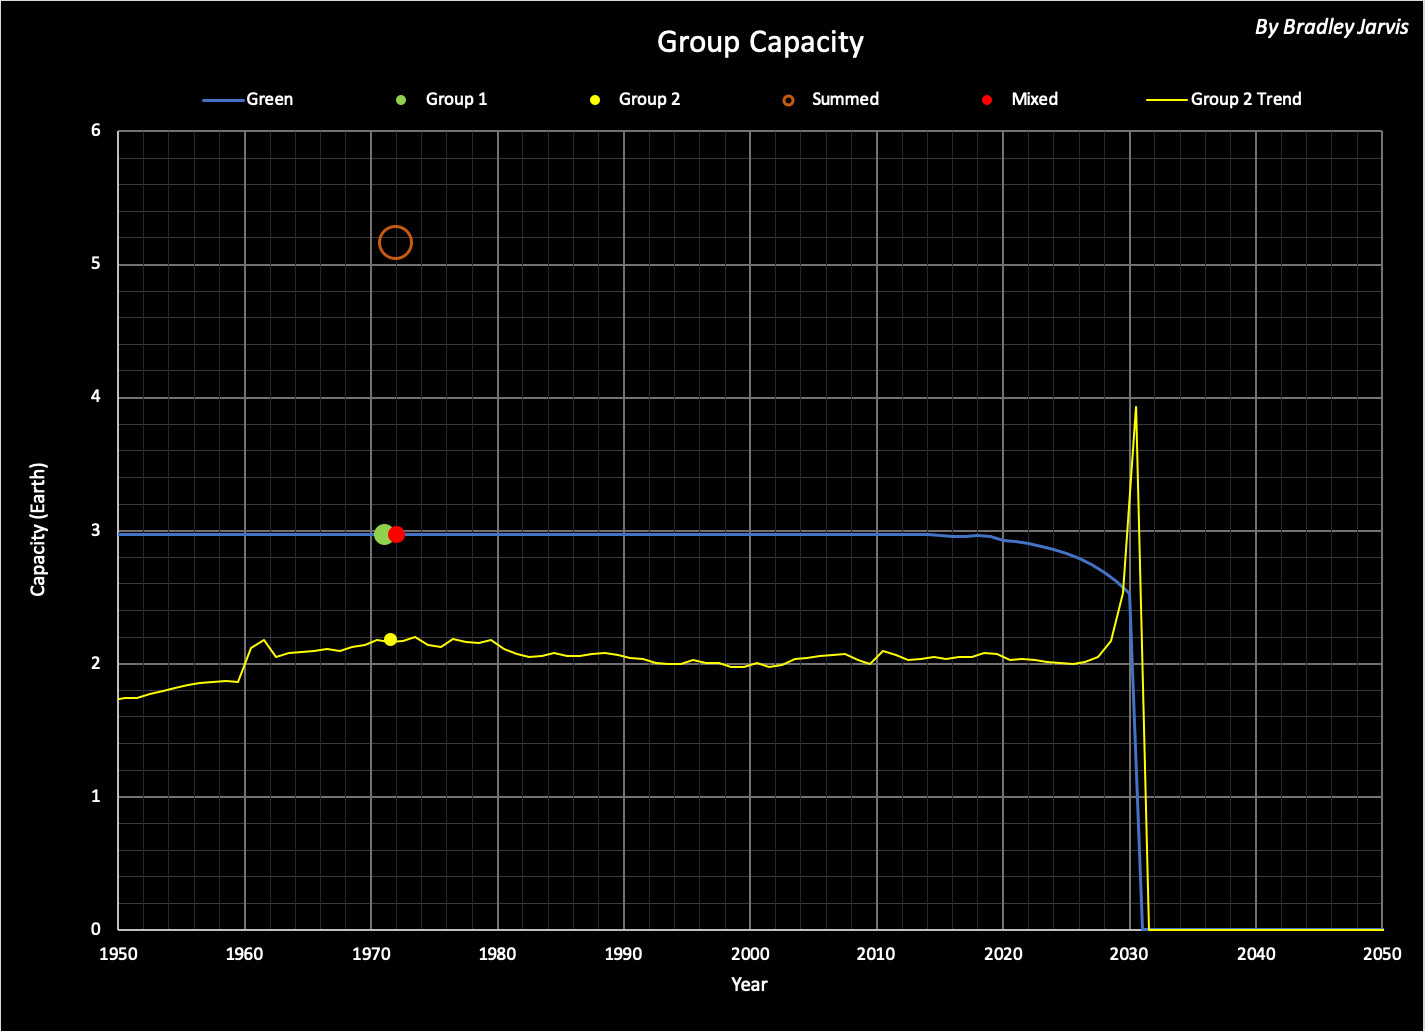
Corresponding graphs of C and Capacity are shown below. Roll over the images for more years.
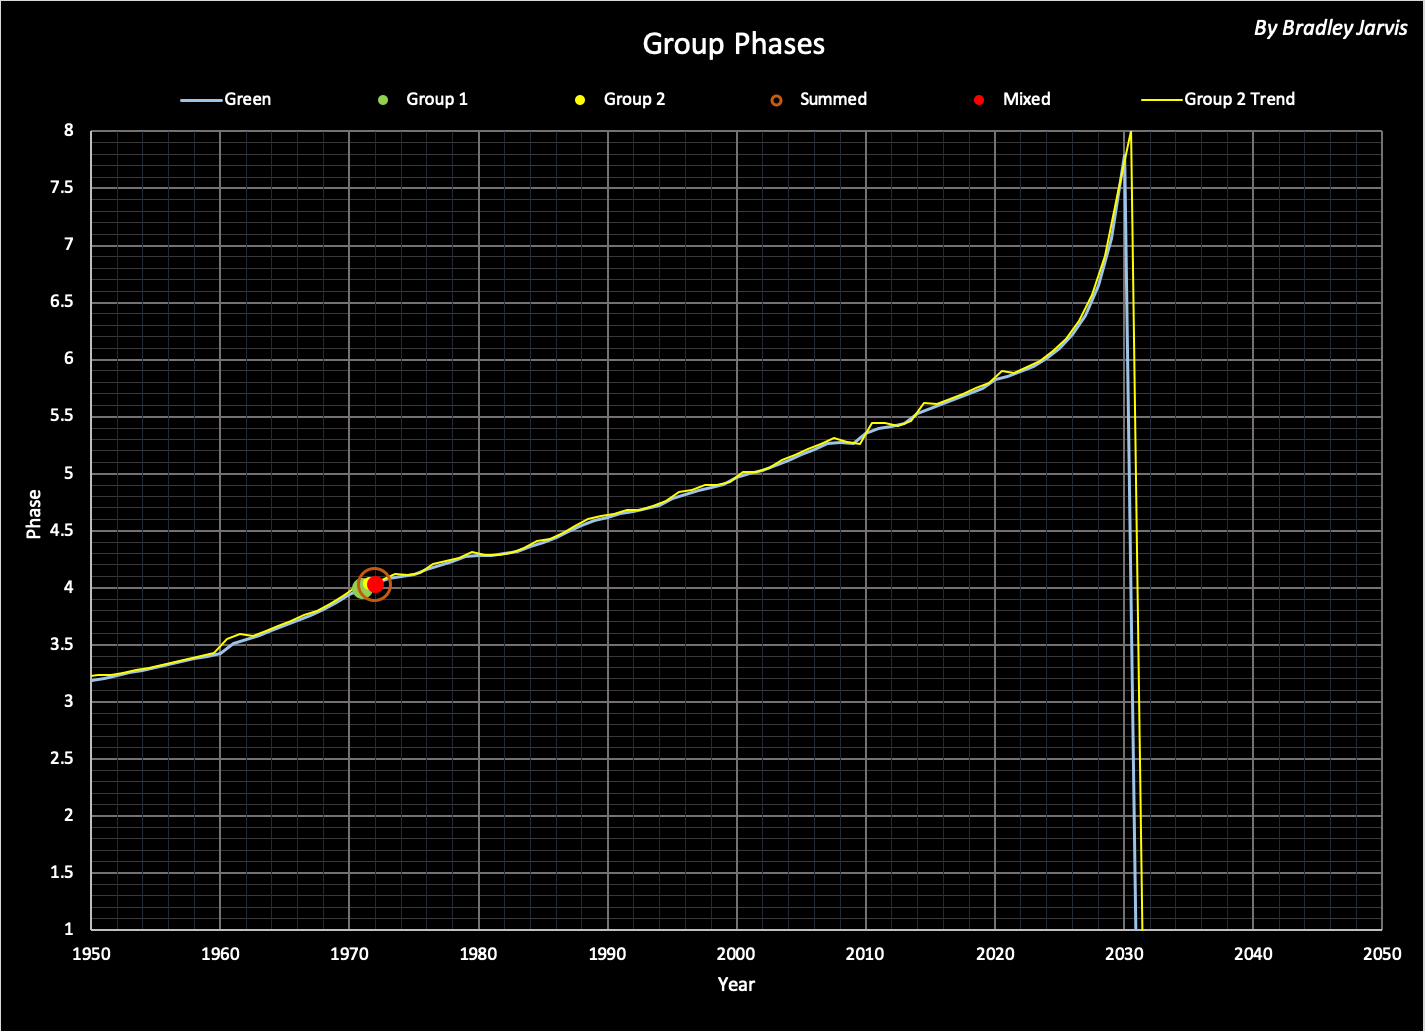
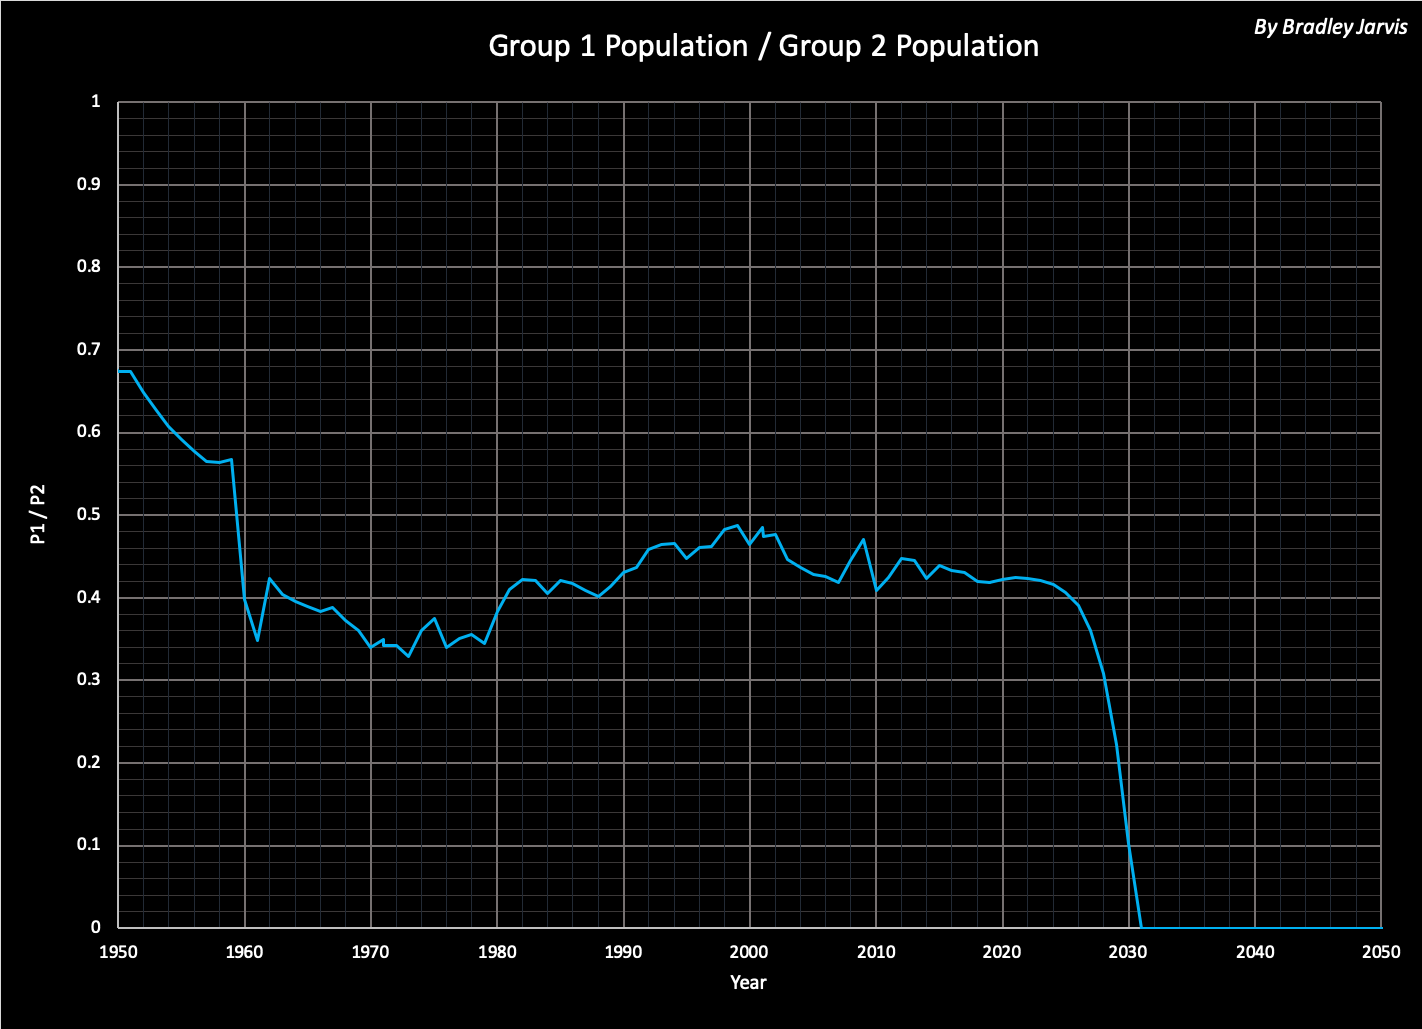
The relative contributions of Groups 1 and 2 to the mix of the two are expressed as the ratio P1/P2 in the following table. Changes over history have some correspondence to phase - and potentially a few notable events.
| Calendar Year | P1/P2 | P1 Phase | Notes |
| 453 | 1230 | 1.6 | Last year that Summed Capacity = Group 1 Capacity |
| 689 | 32 | 1.7 | Rennaissance |
| 1396 | 8 | 2.0 | Development phase |
| 1906 | 2 | 2.7 | Group 2 Capacity = 1 Earth in 1907 |
| 1932 | 1 | 3.0 | Adaptation phase; Great Depression |
| 1971 | 1/3 | 4.0 | Climax phase; P1 Consumption > 1 Earth |
| 2001 | 1/2 | 5.0 | Exploitation phase |
| 2024 | 2/5 | 6.0 | Decline phase; peak population |
| 2029 | 1/9 | 7.0 | Termination phase then extinction |
See also:
- Timelines Version 5 (includes definitions)
- Phases
- C-low Simulation