C-low Simulation
NOTE: Terms in italics are defined in Timelines Version 5.
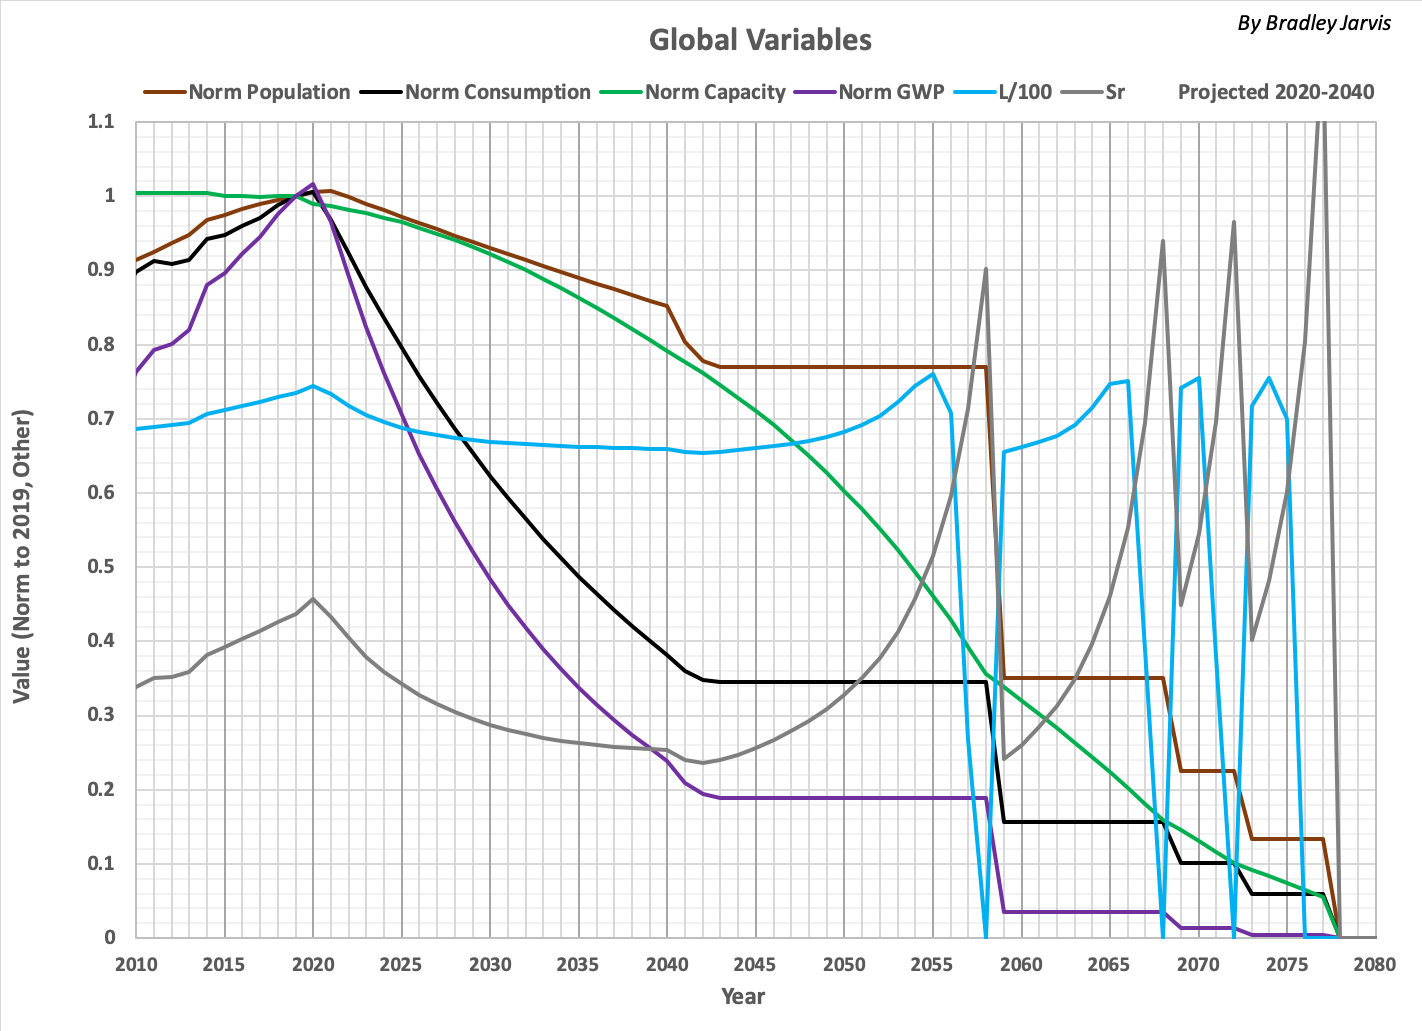
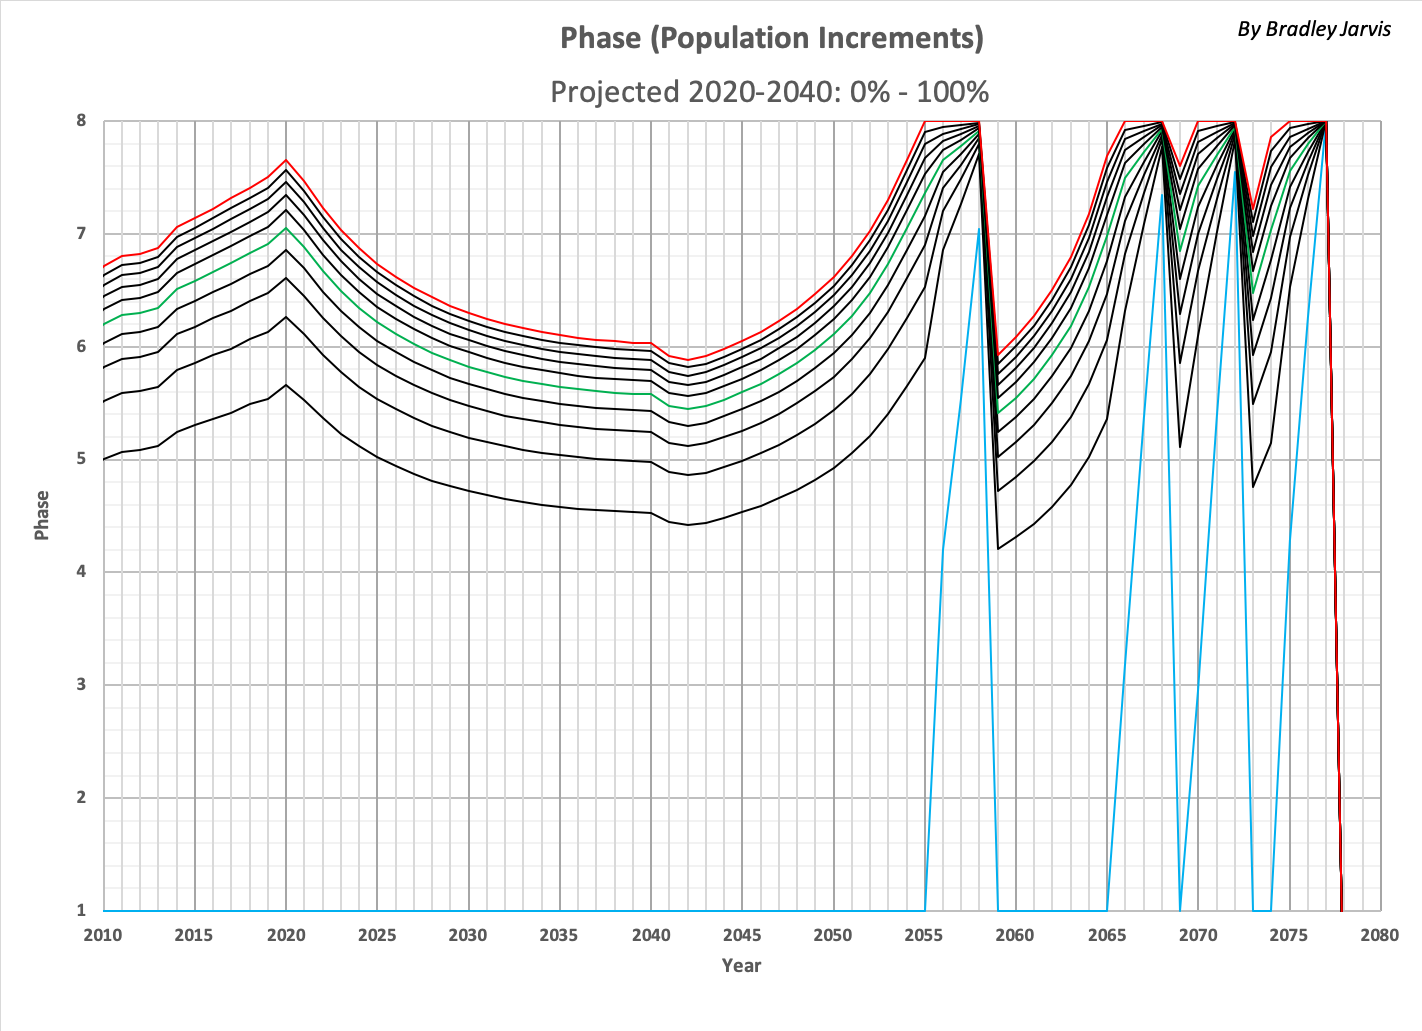
The following graphs illustrate a simulation (called "C-low") that reduces per-capita consumption at a roughly fixed rate to a low, fixed level over the period 2020-2040 and keeps it constant (at 1.5 resources) until it is forced to drop as the result of external impact. Population is also reduced at a fixed rate over the same period, and attempts to stay constant unless it exceeds Pmax as a result of changing Sr.
See also:
- Timelines Version 5 (incliudes definitions)
- Phases