Timeline 4
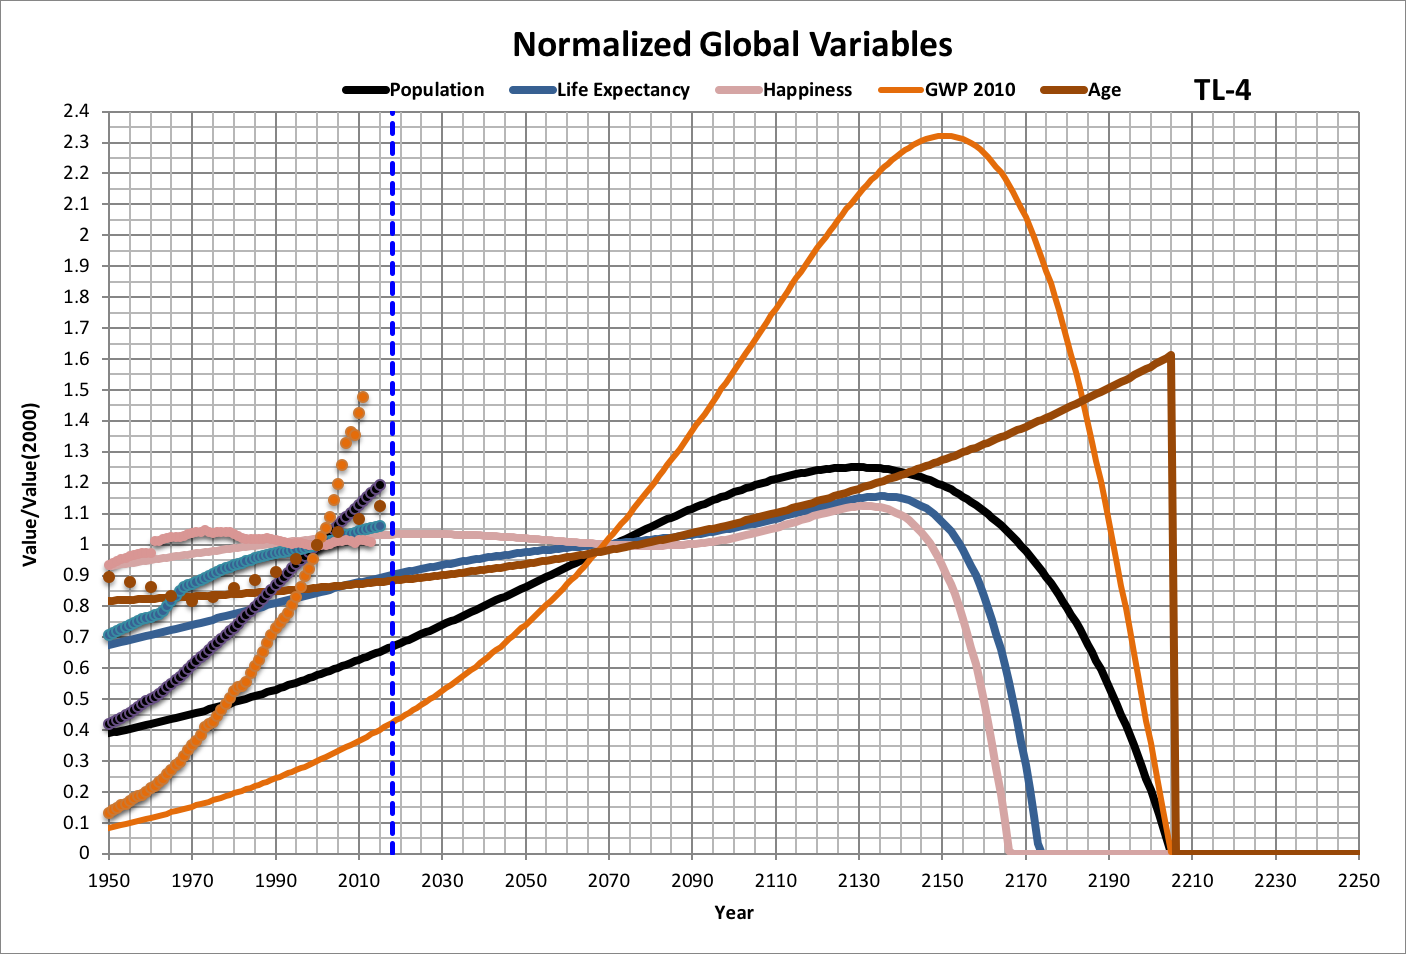
Timeline 4 (TL-4) projects how global vriables might have changed if trends fron 1650 to 1947 had continued.
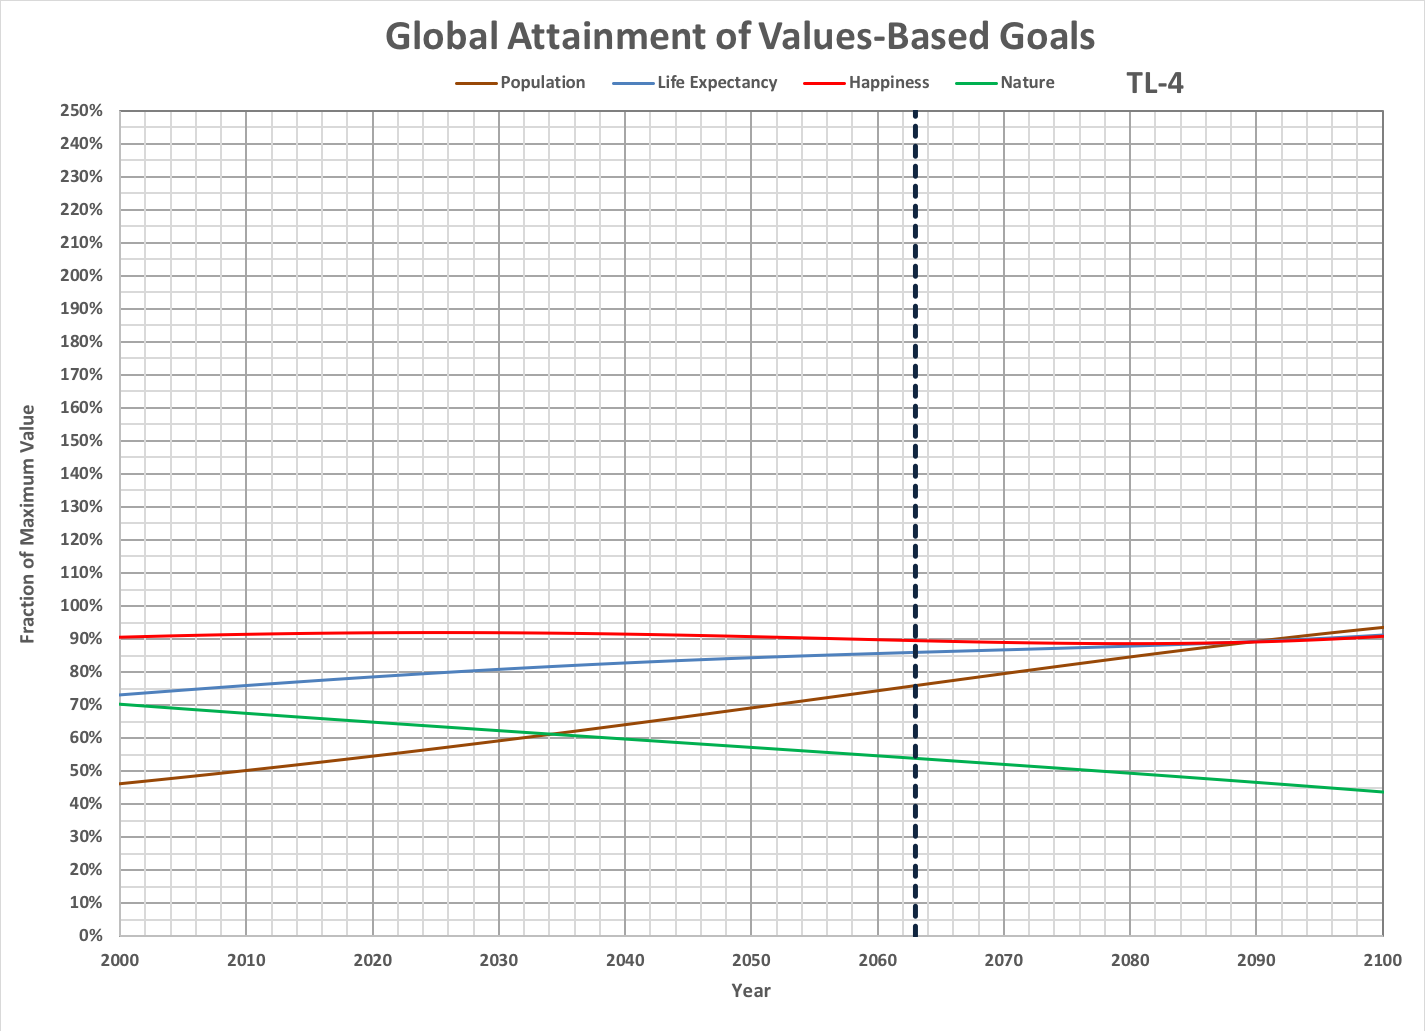
The following graph shows goal attainment from 2000-2100. The 2063 is indicated, which is the year that the population in TL-5 achieves total happiness. Note that the 100% values are the maximum attainable for TL-2.
See also: