Timeline 3
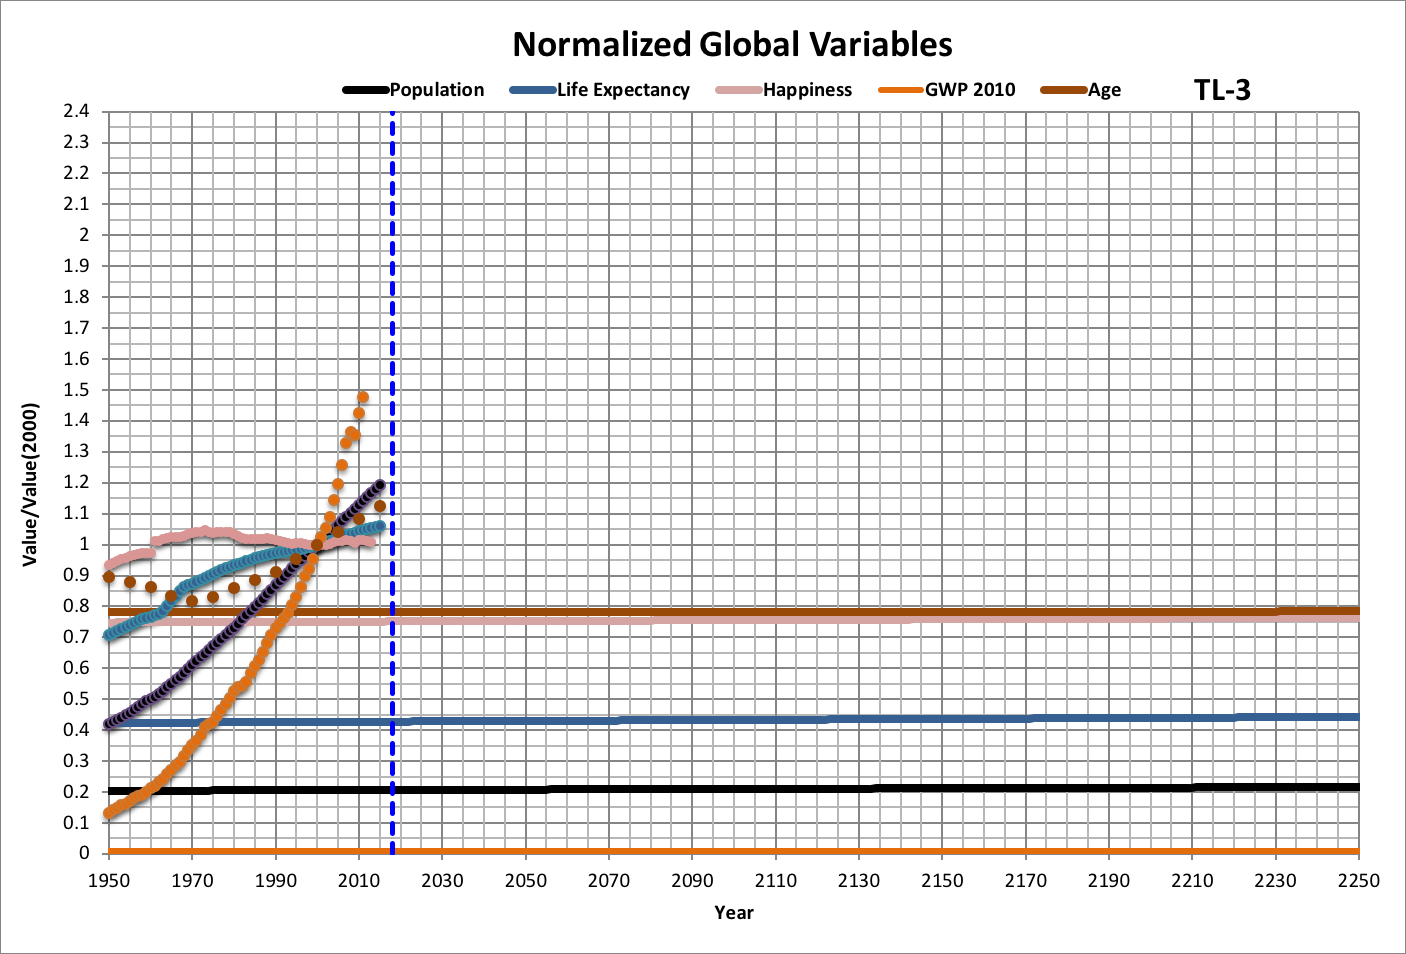
Timeline 3 (TL-3) projects how global variables might have evolved over time if the trends from 5000 B.C. to 1650 A.D. had continued.
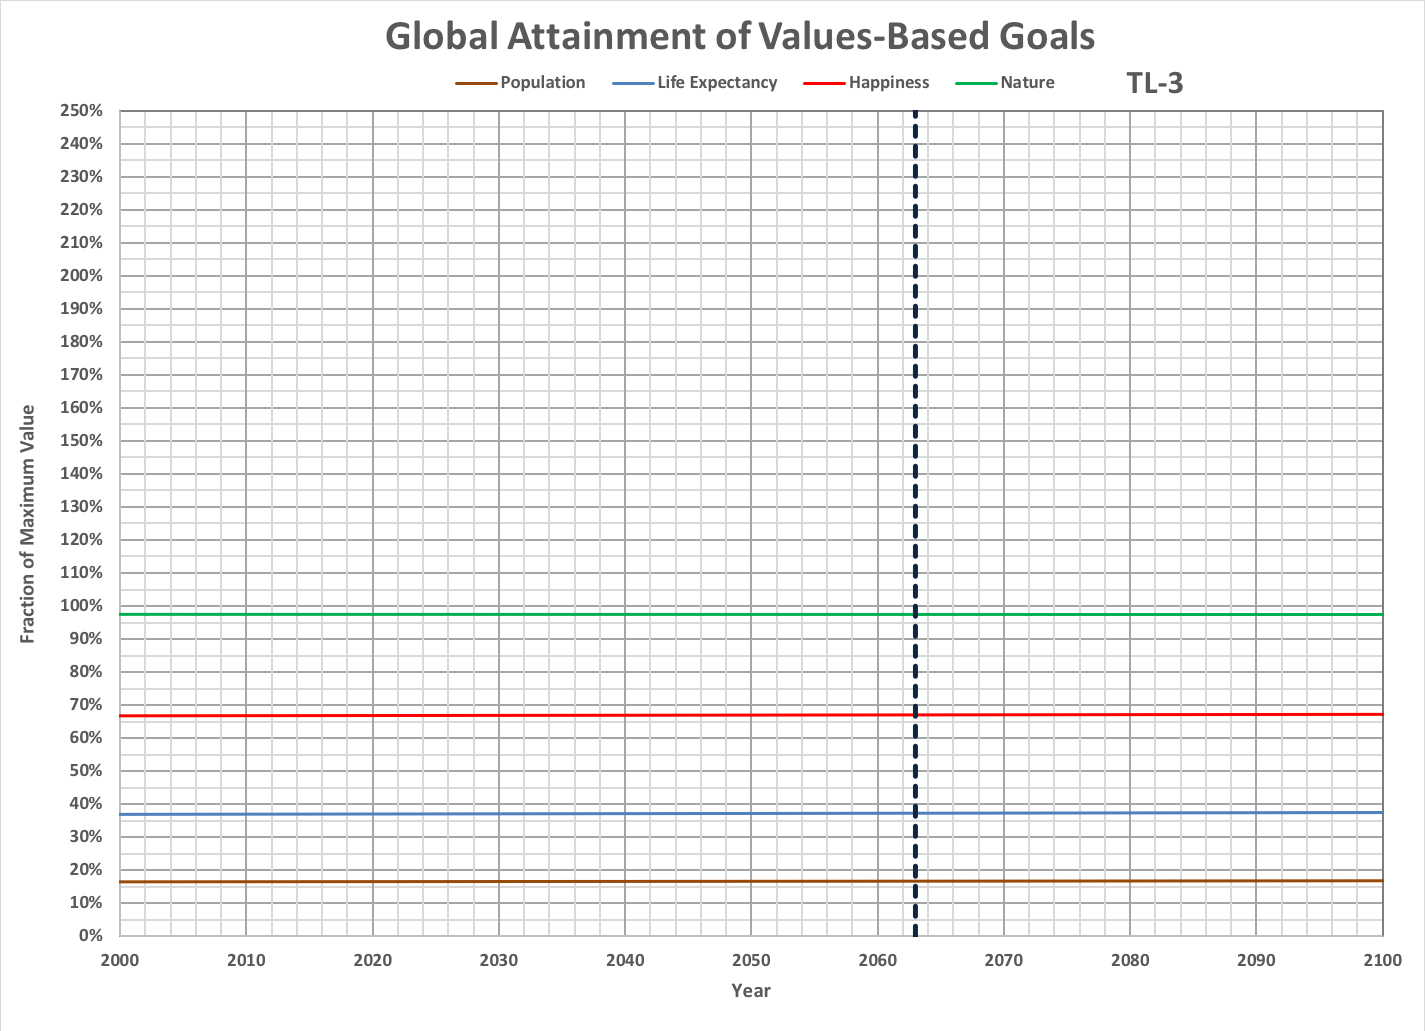
The following graph shows projected attainment of goals. The year that the best-case timeline (TL-5) attains total happiness for its population is indicated for reference. Note that the 100% values are the maximum attainable for TL-2. Roll over the image to see a longer timespan.
See also: