Limits
The following limits and conditions may be reached according the Half-Earth Hypothesis (see Priority Interdependencies for variable definitions):
| Range ID | Range | Conditions |
| A | Fe + FeMin < 1 |
|
| B | 1 <= Fe + FeMin < FeTotal - FeMin |
|
| C | FeTotal - FeMin < Fe + FeMin < FeTotal |
|
| D | Fe = FeTotal |
|
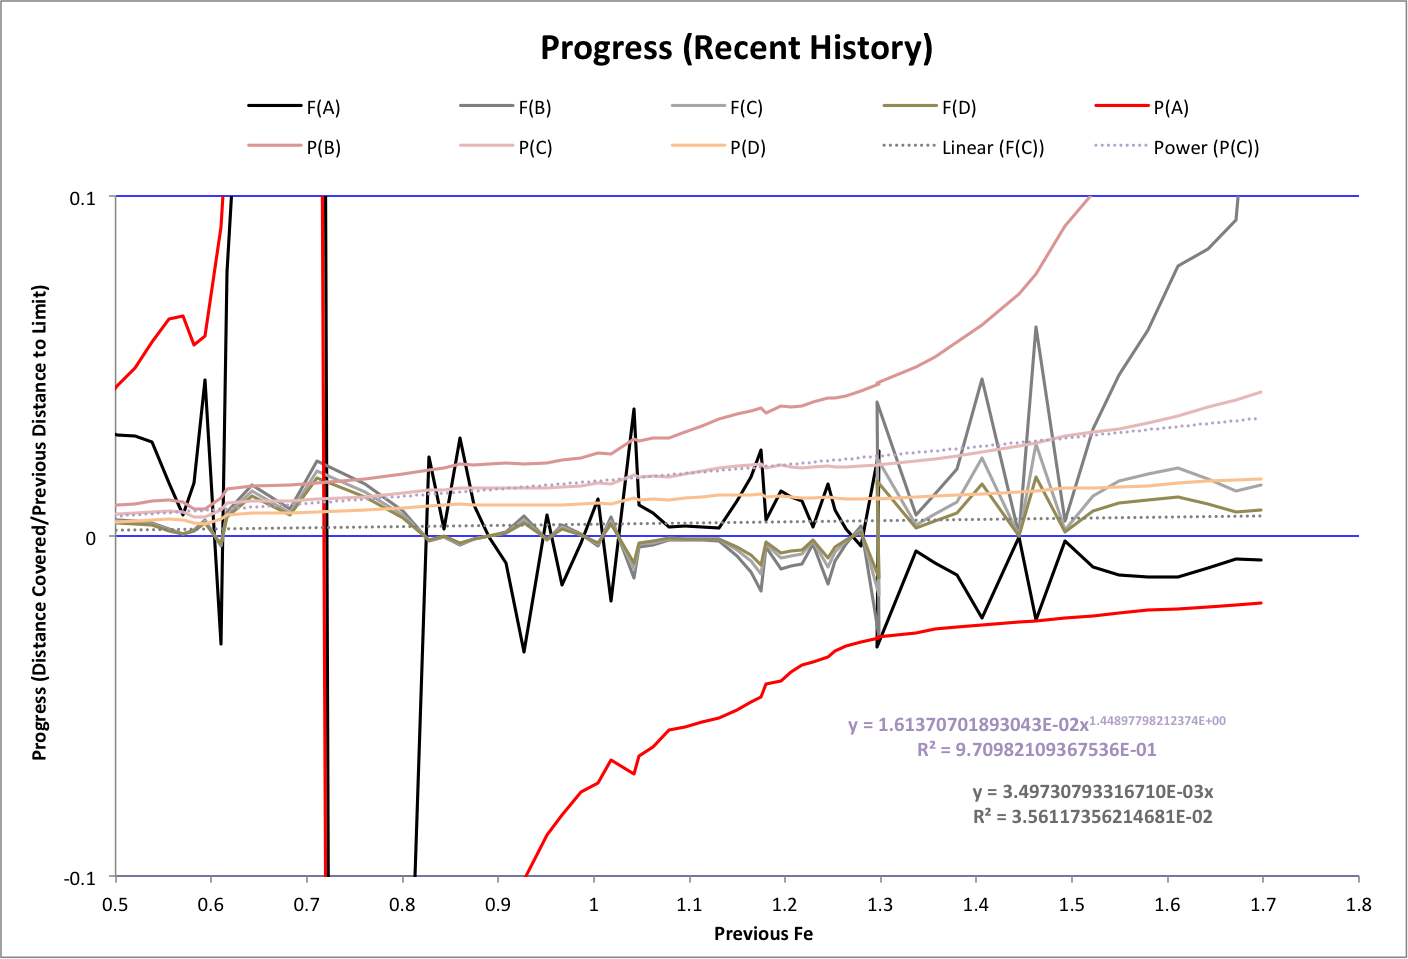
Historically it appears that humanity's population P and footprint F are converging toward the upper limit of range C. This is seen below in a graph of progress toward each upper limit for each of the years 1950-2015. Dotted lines are curve-fits.
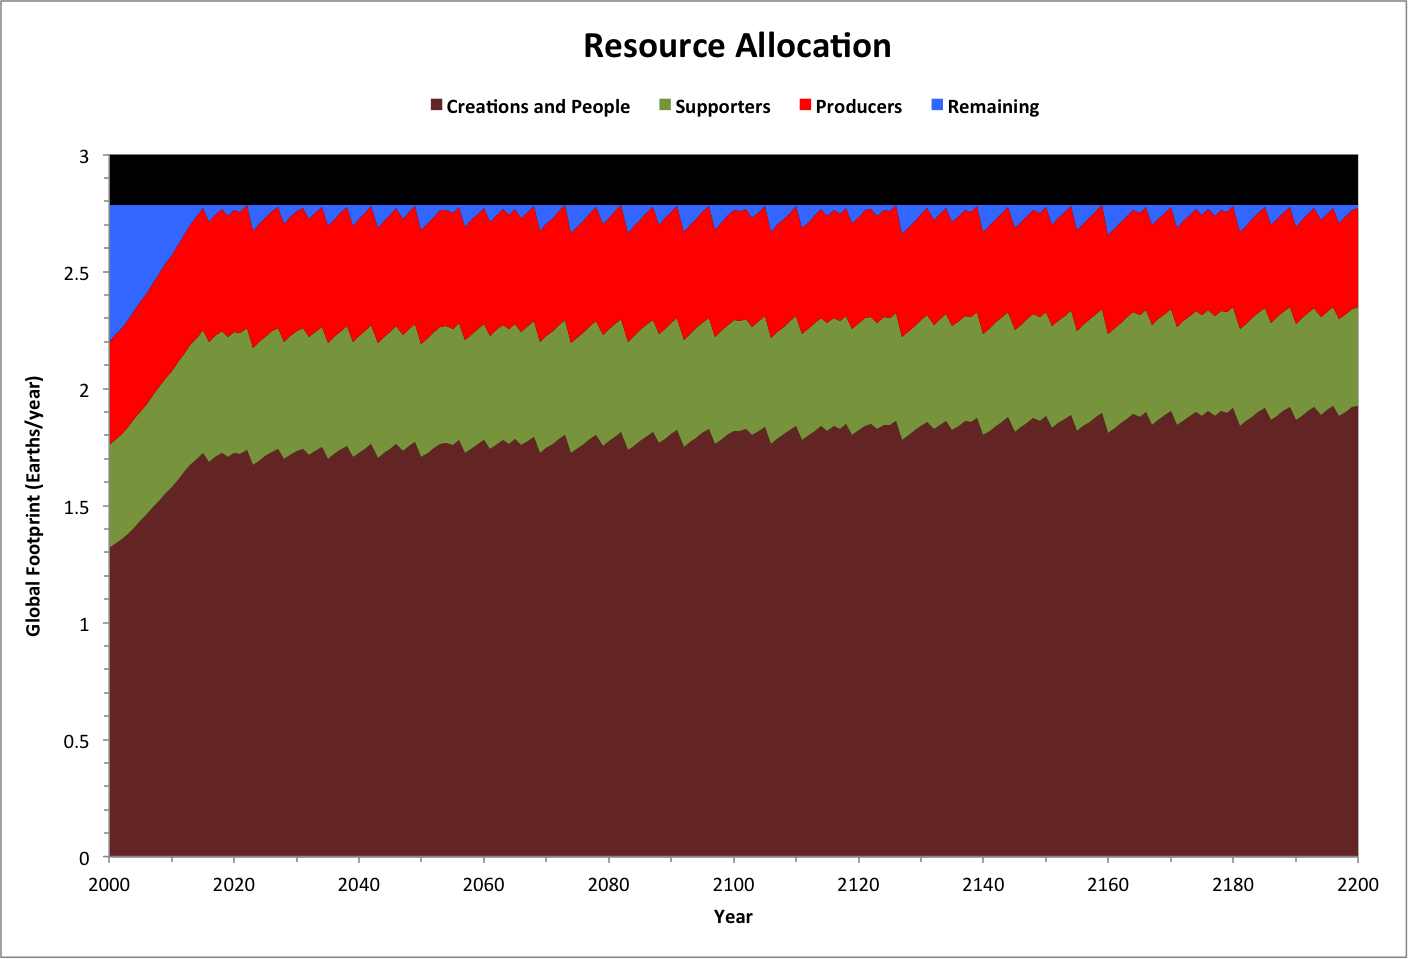
The following graph shows how ecological resources are distributed over time in terms of global footprint, and using the terminology of the Half-Earth hypothesis.
Note:
- Supporters and producers are each equal to FeMin
- The upper limit of range A ("limit A") is reached when creations and people (Fe) and supporters (FeMin) together equal 1 Earth/year
- Limit B is reached when there are no remaining resources
- Limit C is reached when there are no producers (producers equal FeMin)
- Limit D is reached when there are no more supporters