Environment History

Happiness may be estimated using the difference between a population's personality and the personality that best thrives in the population's environment. More generally, we can divide people into a range of "person types," each corresponding to a way of experiencing and interacting with the world.

We can use estimates of historical happiness to estimate how each environment type is changing, subject to the following assumptions:

  1. The general numerical score for person type (Ptype) for the world's population varies from 0 to 1, with an average of 0.5.
  2. There is a one-to-one correspondence between each person type and a subset of the world they experience and interact with (their "environment type"), which can be represented by a numerical score (Etype) between two extremes.
  3. Happiness (H) varies with Ptype and Etype as described in Personality and Happiness, where Ptype is equivalent to Preferred, and Etype is equivalent to Environment.

The following relationships follow from these assumptions:

Minimum Etype = 2 - Maximum H

Average Etype = 1.5 - Average H

Maximum Etype = 1 - Minimum H


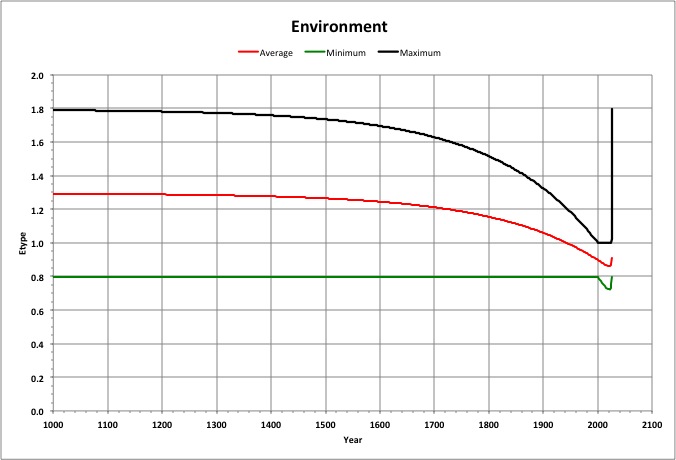
This graph of the results shows that the main effect of humans on the environment has been to reduce its variability by lowering its maximum value.


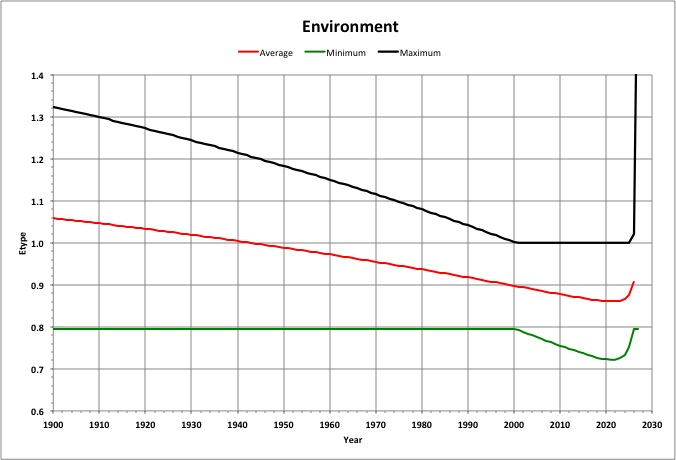
Close up, we see that the average environment came under human control (fell below 1.0) in 1943, and will bottom out in 2022, just after the projected population peak.

The environment's maximum value stopped decreasing in 2001, when some people couldn't get any happier. Afterwards, the environment's minimum value decreased, widening the range of environments and increasing the happiness of more people.


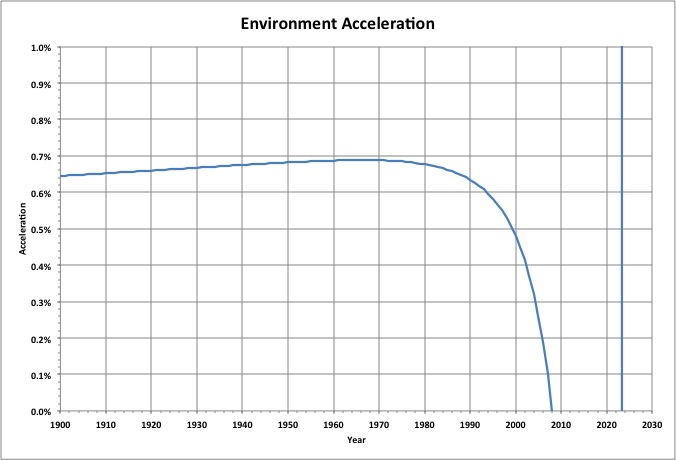
This graph shows how fast the slope of the average environment changes (its acceleration).

The acceleration reached a maximum in 1965, and dropped below zero (started decelerating) in 2007.


For a discussion of this topic, see the blog post Environment Control.

For a comparison of variables by Ptype, see Ptype Comparisons.


© Copyright 2011 Bradley Jarvis. All rights reserved.