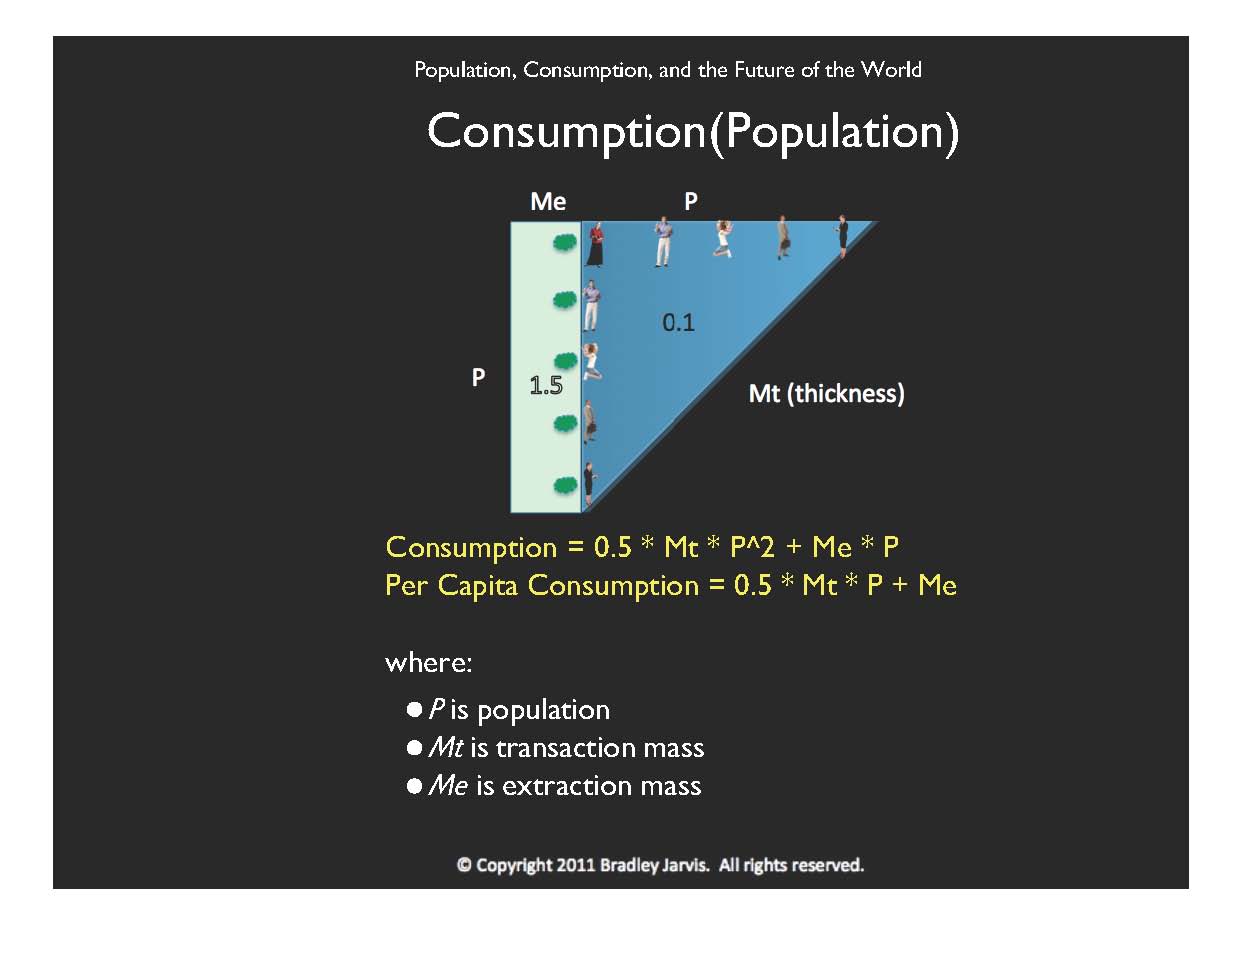
Here is my explanation of how total consumption changes with population; that is, the total ecological impact of the world's population: the ecological footprint times the number of people. This is the essence of my "population-consumption model."
The light green rectangle represents the total of what each person consumes regardless of how big the population gets. I call that the "extraction mass" because it's the amount of resources extracted from the Earth either by, or for, each person. Note that because the amounts are so large, I'm using a unit of one Earth per year, and that the rectangle has a thickness of one of these units. The total volume of the rectangle is currently about 1.5 Earths per year. Keep in mind that this diagram is not to scale.
As the population grows, some resources are consumed purely in the interaction between people. The consumption per interaction is what I call "transaction mass," and the total amount consumed in this way is represented by the blue triangle. Notice that although the triangle has a large area is very large, it is also very thin, so its total volume -- the amount consumed -- is currently only about 0.1 Earth per year, or 1/16th of the total world consumption.
Relating to the graph of population versus footprint, the slope of the graph is half the transaction mass (because we're talking about a triangle, which is half a square), and the consumption at zero population (really, one person) is just the extraction mass.
© Copyright 2011 Bradley Jarvis. All rights reserved.